PG&E 2007 Annual Report Download - page 40
Download and view the complete annual report
Please find page 40 of the 2007 PG&E annual report below. You can navigate through the pages in the report by either clicking on the pages listed below, or by using the keyword search tool below to find specific information within the annual report.-
 1
1 -
2
-
3
-
4
-
5
-
6
-
7
-
8
-
9
-
10
-
11
-
12
-
13
-
14
-
15
-
16
-
17
-
18
-
19
-
20
-
21
-
22
-
23
-
24
-
25
-
26
-
27
-
28
-
29
-
 30
30 -
 31
31 -
 32
32 -
 33
33 -
 34
34 -
 35
35 -
 36
36 -
 37
37 -
 38
38 -
 39
39 -
 40
40 -
 41
41 -
 42
42 -
 43
43 -
 44
44 -
 45
45 -
 46
46 -
 47
47 -
 48
48 -
 49
49 -
 50
50 -
51
-
52
-
53
-
54
-
55
-
56
-
57
-
58
-
59
-
60
-
61
-
62
-
63
-
64
-
65
-
66
-
67
-
68
-
69
-
70
-
71
-
72
-
73
-
74
-
75
-
76
-
77
-
78
-
79
-
80
-
81
-
82
-
83
-
84
-
85
-
86
-
87
-
88
-
89
-
90
-
91
-
92
-
93
-
94
-
95
-
96
-
97
-
98
-
99
-
100
-
101
-
102
-
103
-
104
-
105
-
106
-
107
-
108
-
109
-
110
-
111
-
112
-
113
-
114
-
115
-
116
-
117
-
118
-
119
-
120
-
121
-
122
-
123
-
124
-
125
-
126
-
127
-
128
-
129
-
130
-
131
-
132
-
133
-
134
-
135
-
136
-
137
-
138
-
139
-
140
-
141
-
142
-
143
-
144
-
145
-
146
-
147
-
148
 |
 |

38
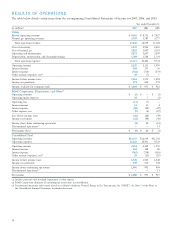
RESULTS OF OPERATIONS
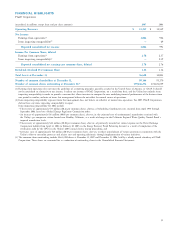
The table below details certain items from the accompanying Consolidated Statements of Income for 2007, 2006, and 2005:
Year ended December 31,
(in millions) 2007 2006 2005
Utility
Electric operating revenues $ 9,481 $ 8,752 $ 7,927
Natural gas operating revenues 3,757 3,787 3,777
Total operating revenues 13,238 12,539 11,704
Cost of electricity 3,437 2,922 2,410
Cost of natural gas 2,035 2,097 2,191
Operating and maintenance 3,872 3,697 3,399
Depreciation, amortization, and decommissioning 1,769 1,708 1,734
Total operating expenses 11,113 10,424 9,734
Operating income 2,125 2,115 1,970
Interest income 150 175 76
Interest expense (732) (710) (554)
Other income (expense), net(1) 38 (7) —
Income before income taxes 1,581 1,573 1,492
Income tax provision 571 602 574
Income available for common stock $ 1,010 $ 971 $ 918
PG&E Corporation, Eliminations, and Other(2)
Operating revenues $ (1) $ — $ (1)
Operating (gain) expenses 10 7 (1)
Operating loss (11) (7) —
Interest income 14 13 4
Interest expense (30) (28) (29)
Other expense, net (9) (6) (19)
Loss before income taxes (36) (28) (44)
Income tax benefi t (32) (48) (30)
Income (loss) from continuing operations (4) 20 (14)
Discontinued operations(3) — — 13
Net income (loss) $ (4) $ 20 $ (1)
Consolidated Total
Operating revenues $13,237 $12,539 $11,703
Operating expenses 11,123 10,431 9,733
Operating income 2,114 2,108 1,970
Interest income 164 188 80
Interest expense (762) (738) (583)
Other income (expense), net(1) 29 (13) (19)
Income before income taxes 1,545 1,545 1,448
Income tax provision 539 554 544
Income from continuing operations 1,006 991 904
Discontinued operations(3) — — 13
Net income $ 1,006 $ 991 $ 917
(1) Includes preferred stock dividend requirement as other expense.
(2) PG&E Corporation eliminates all intercompany transactions in consolidation.
(3) Discontinued operations refl ect items related to its former subsidiary, National Energy & Gas Transmission, Inc (“NEGT”). See Note 7 of the Notes to
the Consolidated Financial Statements for further discussion.