PG&E 2007 Annual Report Download - page 133
Download and view the complete annual report
Please find page 133 of the 2007 PG&E annual report below. You can navigate through the pages in the report by either clicking on the pages listed below, or by using the keyword search tool below to find specific information within the annual report.-
 1
1 -
2
-
3
-
4
-
5
-
6
-
7
-
8
-
9
-
10
-
11
-
12
-
13
-
14
-
15
-
16
-
17
-
18
-
19
-
20
-
21
-
22
-
23
-
24
-
25
-
26
-
27
-
28
-
29
-
30
-
31
-
32
-
33
-
34
-
35
-
36
-
37
-
38
-
39
-
40
-
41
-
42
-
43
-
44
-
45
-
46
-
47
-
48
-
49
-
50
-
51
-
52
-
53
-
54
-
55
-
56
-
57
-
58
-
59
-
60
-
61
-
62
-
63
-
64
-
65
-
66
-
67
-
68
-
69
-
70
-
71
-
72
-
73
-
74
-
75
-
76
-
77
-
78
-
79
-
80
-
81
-
82
-
83
-
84
-
85
-
86
-
87
-
88
-
89
-
90
-
91
-
92
-
93
-
94
-
95
-
96
-
97
-
98
-
99
-
100
-
101
-
102
-
103
-
104
-
105
-
106
-
107
-
108
-
109
-
110
-
111
-
112
-
113
-
114
-
115
-
116
-
117
-
118
-
119
-
120
-
121
-
122
-
 123
123 -
 124
124 -
 125
125 -
 126
126 -
 127
127 -
 128
128 -
 129
129 -
 130
130 -
 131
131 -
 132
132 -
 133
133 -
 134
134 -
 135
135 -
 136
136 -
 137
137 -
 138
138 -
 139
139 -
 140
140 -
 141
141 -
 142
142 -
 143
143 -
144
-
145
-
146
-
147
-
148
 |
 |

131
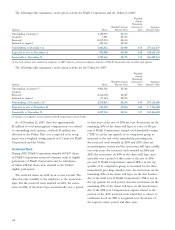
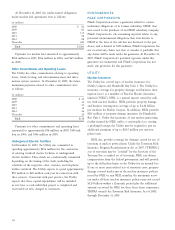
At December 31, 2007, the undiscounted future expected power purchase agreement payments were as follows:
Irrigation District &
Qualifying Facility Water Agency Renewable Other
Operations & Debt
(in millions) Energy Capacity Maintenance Service Energy Capacity Energy Capacity
2008 $ 1,306 $ 464 $ 57 $ 26 $ 231 $14 $ 6 $232
2009 1,277 423 49 26 308 11 9 210
2010 1,159 389 67 22 346 7 8 159
2011 1,141 376 35 21 488 7 8 45
2012 1,029 345 30 21 524 7 8 18
Thereafter 7,063 2,213 72 53 6,840 — 11 2
Total $12,975 $4,210 $310 $169 $8,737 $46 $50 $666
The following table shows the future fi xed capacity pay-
ments due under the QF contracts that are treated as capital
leases. These amounts are also included in the table above.
The fi xed capacity payments are discounted to the present
value shown in the table below using the Utility’s incremen-
tal borrowing rate at the inception of the leases. The amount
of this discount is shown in the table below as the amount
representing interest:
(in millions)
2008 $ 50
2009 50
2010 50
2011 50
2012 50
Thereafter 253
Total fi xed capacity payments 503
Amount representing interest 131
Present value of fi xed capacity payments $372
Interest and amortization expense associated with
the lease obligation is included in the cost of electricity
on PG&E Corporation’s and the Utility’s Consolidated
Statements of Income. In accordance with SFAS No. 71, the
timing of the Utility’s capacity payments will conform to
the ratemaking treatment for the Utility’s recovery of the
cost of electricity. The QF contracts that are treated as capital
leases expire between April 2014 and September 2021.
The Utility’s Consolidated Balance Sheet has included
in Current Liabilities — Other and Noncurrent Liabilities —
Other approximately $28 million and $344 million, respec-
tively, as of December 31, 2007, representing the present
value of the fi xed capacity payments due under these con-
tracts. The corresponding assets of $372 million, including
amortization of $36 million, are included in property, plant,
and equipment on the Utility’s Consolidated Balance Sheet
at December 31, 2007.
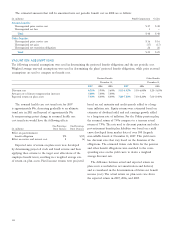
Natural Gas Supply and Transportation Commitments
The Utility purchases natural gas directly from producers and
marketers in both Canada and the United States to serve its
core customers. The contract lengths and natural gas sources
of the Utility’s portfolio of natural gas procurement contracts
have fl uctuated generally based on market conditions.
At December 31, 2007, the Utility’s undiscounted obliga-
tions for natural gas purchases and gas transportation services
were as follows:
(in millions)
2008 $1,181
2009 222
2010 22
2011 14
2012 7
Thereafter —
Total $1,446
Payments for natural gas purchases and gas transportation
services amounted to approximately $2.2 billion in 2007,
$2.2 billion in 2006, and $2.5 billion in 2005.
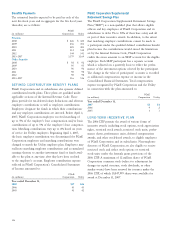
Nuclear Fuel Agreements
The Utility has entered into several purchase agreements for
nuclear fuel. These agreements have terms ranging from one
to thirteen years and are intended to ensure long-term fuel
supply. The contracts for uranium and conversion services
provide for 100% coverage of reactor requirements through
2010, while contracts for enrichment services provide for
100% coverage of reactor requirements through 2009. The
Utility relies on a number of international producers of
nuclear fuel in order to diversify its sources and provide
security of supply. Pricing terms also are diversifi ed, ranging
from market-based prices to base prices that are escalated
using published indices. New agreements are primarily based
on forward market pricing and will begin to impact nuclear
fuel costs starting in 2010.