HP 2007 Annual Report Download - page 89
Download and view the complete annual report
Please find page 89 of the 2007 HP annual report below. You can navigate through the pages in the report by either clicking on the pages listed below, or by using the keyword search tool below to find specific information within the annual report.-
 1
1 -
2
-
3
-
4
-
5
-
6
-
7
-
8
-
9
-
10
-
11
-
12
-
13
-
14
-
15
-
16
-
17
-
18
-
19
-
20
-
21
-
22
-
23
-
24
-
25
-
26
-
27
-
28
-
29
-
30
-
31
-
32
-
33
-
34
-
35
-
36
-
37
-
38
-
39
-
40
-
41
-
42
-
43
-
44
-
45
-
46
-
47
-
48
-
49
-
50
-
51
-
52
-
53
-
54
-
55
-
56
-
57
-
58
-
59
-
60
-
61
-
62
-
63
-
64
-
65
-
66
-
67
-
68
-
69
-
70
-
71
-
72
-
73
-
74
-
75
-
76
-
77
-
78
-
 79
79 -
 80
80 -
 81
81 -
 82
82 -
 83
83 -
 84
84 -
 85
85 -
 86
86 -
 87
87 -
 88
88 -
 89
89 -
 90
90 -
 91
91 -
 92
92 -
 93
93 -
 94
94 -
 95
95 -
 96
96 -
 97
97 -
 98
98 -
 99
99 -
100
-
101
-
102
-
103
-
104
-
105
-
106
-
107
-
108
-
109
-
110
-
111
-
112
-
113
-
114
-
115
-
116
-
117
-
118
-
119
-
120
-
121
-
122
-
123
-
124
-
125
-
126
-
127
-
128
-
129
-
130
-
131
-
132
-
133
-
134
-
135
-
136
-
137
-
138
-
139
-
140
-
141
-
142
-
143
-
144
-
145
-
146
-
147
-
148
-
149
-
150
-
151
-
152
-
153
-
154
-
155
-
156
-
157
-
158
-
159
-
160
-
161
-
162
-
163
-
164
-
165
-
166
-
167
-
168
-
169
-
170
-
171
-
172
-
173
-
174
-
175
-
176
-
177
-
178
-
179
-
180
 |
 |

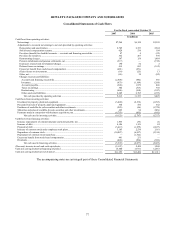
HEWLETT-PACKARD COMPANY AND SUBSIDIARIES
Consolidated Statements of Earnings
For the fiscal years ended October 31
2007 2006 2005
In millions, except per share amounts
Net revenue:
Products ........................................................................................................................... $84,229 $73,557 $68,945
Services............................................................................................................................ 19,699 17,773 17,380
Financing income............................................................................................................. 358 328 371
Total net revenue........................................................................................................... 104,286 91,658 86,696
Costs and expenses:
Cost of products............................................................................................................... 63,435 55,248 52,550
Cost of services................................................................................................................ 15,163 13,930 13,674
Financing interest............................................................................................................. 289 249 216
Research and development .............................................................................................. 3,611 3,591 3,490
Selling, general and administrative.................................................................................. 12,226 11,266 11,184
Amortization of purchased intangible assets.................................................................... 783 604 622
In-process research and development charges ................................................................. 190 52 2
Restructuring charges....................................................................................................... 387 158 1,684
Pension curtailments and pension settlements, net .......................................................... (517) —(199)
Total operating expenses............................................................................................... 95,567 85,098 83,223
Earnings from operations.................................................................................................... 8,719 6,560 3,473
Interest and other, net .........................................................................................................444 60683
Gains (losses) on investments............................................................................................. 14 25 (13)
Earnings before taxes.......................................................................................................... 9,177 7,191 3,543
Provision for taxes .............................................................................................................. 1,913 993 1,145
Net earnings........................................................................................................................ $7,264 $6,198 $2,398
Net earnings per share:
Basic ................................................................................................................................ $2.76 $2.23 $0.83
Diluted ............................................................................................................................. $2.68 $2.18 $0.82
Weighted-average shares used to compute net earnings per share:
Basic ................................................................................................................................ 2,630 2,782 2,879
Diluted ............................................................................................................................. 2,716 2,852 2,909
The accompanying notes are an integral part of these Consolidated Financial Statements.
75