HP 2007 Annual Report Download - page 144
Download and view the complete annual report
Please find page 144 of the 2007 HP annual report below. You can navigate through the pages in the report by either clicking on the pages listed below, or by using the keyword search tool below to find specific information within the annual report.-
 1
1 -
2
-
3
-
4
-
5
-
6
-
7
-
8
-
9
-
10
-
11
-
12
-
13
-
14
-
15
-
16
-
17
-
18
-
19
-
20
-
21
-
22
-
23
-
24
-
25
-
26
-
27
-
28
-
29
-
30
-
31
-
32
-
33
-
34
-
35
-
36
-
37
-
38
-
39
-
40
-
41
-
42
-
43
-
44
-
45
-
46
-
47
-
48
-
49
-
50
-
51
-
52
-
53
-
54
-
55
-
56
-
57
-
58
-
59
-
60
-
61
-
62
-
63
-
64
-
65
-
66
-
67
-
68
-
69
-
70
-
71
-
72
-
73
-
74
-
75
-
76
-
77
-
78
-
79
-
80
-
81
-
82
-
83
-
84
-
85
-
86
-
87
-
88
-
89
-
90
-
91
-
92
-
93
-
94
-
95
-
96
-
97
-
98
-
99
-
100
-
101
-
102
-
103
-
104
-
105
-
106
-
107
-
108
-
109
-
110
-
111
-
112
-
113
-
114
-
115
-
116
-
117
-
118
-
119
-
120
-
121
-
122
-
123
-
124
-
125
-
126
-
127
-
128
-
129
-
130
-
131
-
132
-
133
-
 134
134 -
 135
135 -
 136
136 -
 137
137 -
 138
138 -
 139
139 -
 140
140 -
 141
141 -
 142
142 -
 143
143 -
 144
144 -
 145
145 -
 146
146 -
 147
147 -
 148
148 -
 149
149 -
 150
150 -
 151
151 -
 152
152 -
 153
153 -
 154
154 -
155
-
156
-
157
-
158
-
159
-
160
-
161
-
162
-
163
-
164
-
165
-
166
-
167
-
168
-
169
-
170
-
171
-
172
-
173
-
174
-
175
-
176
-
177
-
178
-
179
-
180
 |
 |

HEWLETT-PACKARD COMPANY AND SUBSIDIARIES
Notes to Consolidated Financial Statements (Continued)
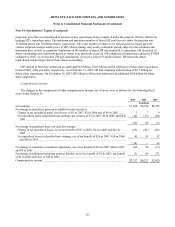
Note 15: Retirement and Post-Retirement Benefit Plans (Continued)
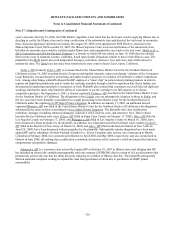
Defined benefit plans with projected benefit obligations exceeding the fair value of plan assets were as follows:
U.S. Defined
Benefit Plans
Non-U.S. Defined
Benefit Plans
2007 2006 2007 2006
In millions
Aggregate fair value of plan assets ..................................................................................... — $4,325 $422 $1,984
Aggregate projected benefit obligation............................................................................... $131 $4,688 $776 $2,411
Defined benefit plans with accumulated benefit obligations exceeding the fair value of plan assets were as follows:
U.S. Defined
Benefit Plans
Non-U.S.
Defined
Benefit Plans
2007 2006 2007 2006
In millions
Aggregate fair value of plan assets .............................................................................................. — — $116 $350
Aggregate accumulated benefit obligation .................................................................................. $124 $146 $360 $586
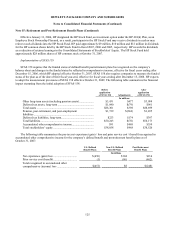
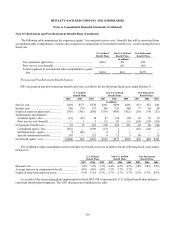
Plan Asset Allocations
HP’ s weighted-average target and asset allocations at the September 30 measurement date were as follows:
U. S. Defined
Benefit Plans
Non-U.S. Defined
Benefit Plans
Post-Retirement
Benefit Plans
2007
Target Plan Assets
2007
Target Plan Assets
2007
Target Plan Assets
Asset Category Allocation 2007 2006 Allocation 2007 2006 Allocation 2007 2006
Public equity securities .............. 62.5% 70.5% 62.1% 63.5% 64.3% 66.8%
Private equity securities............. 5.8% 3.4% — — 11.5% 8.6%
Real estate and other.................. 0.6% 0.3% 6.5% 2.6% 0.9% 0.7%
Equity-related investments ........ 70% 68.9% 74.2% 67% 68.6% 66.1% 76% 76.7% 76.1%
Public debt securities ................. 28% 28.0% 25.8% 33% 30.9% 33.4% 21% 20.5% 23.9%
Cash ........................................... 2%
3.1% — — 0.5% 0.5% 3% 2.8% —
Total........................................ 100% 100% 100% 100% 100.0% 100.0% 100% 100.0% 100.0%
Investment Policy
HP’ s investment strategy for worldwide plan assets is to seek a competitive rate of return relative to an appropriate level
of risk. The majority of the plans’ investment managers employ active investment management strategies with the goal of
outperforming the broad markets in which they invest. Risk management practices include diversification across asset classes
and investment styles and periodic rebalancing toward asset allocation targets. A number of the plans’ investment managers
are
130