HP 2007 Annual Report Download - page 75
Download and view the complete annual report
Please find page 75 of the 2007 HP annual report below. You can navigate through the pages in the report by either clicking on the pages listed below, or by using the keyword search tool below to find specific information within the annual report.
HEWLETT-PACKARD COMPANY AND SUBSIDIARIES
Management’s Discussion and Analysis of
Financial Condition and Results of Operations (Continued)
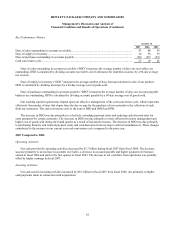
The year-over-year decrease in operating losses was driven primarily by higher earnings from operations generated by
network infrastructure products.
In fiscal 2006, the majority of the net revenue in Corporate Investments related to network infrastructure products, which
grew 8% from fiscal 2005 as a result of increased sales of gigabit Ethernet switch products.
Corporate Investments’ loss from operations in fiscal 2006 decreased compared to fiscal 2005 due primarily to lower
operating expenses related to global alliances and HP Labs and higher gross profits from network infrastructure products. The
decrease in operating expenses was due primarily to savings resulting from restructuring actions and lower program
spending. Expenses related to global alliances and HP Labs contributed to the majority of the loss from operations.
LIQUIDITY AND CAPITAL RESOURCES
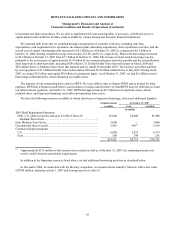
Our cash balances are held in numerous locations throughout the world, including substantial amounts held outside of
the United States. Most of the amounts held outside of the United States could be repatriated to the United States but under
current law would be subject to United States federal income taxes, less applicable foreign tax credits. Repatriation of some
foreign balances is restricted by local laws. We have provided for the United States federal tax liability on these amounts for
financial statement purposes, except for foreign earnings that are considered indefinitely reinvested outside of the United
States. Repatriation could result in additional United States federal income tax payments in future years. Our intent is that
most of the non-U.S. cash balances would remain outside of the United States and we would meet United States liquidity
needs through ongoing cash flows, external borrowings, or both. We utilize a variety of tax planning and financing strategies
in an effort to ensure that our worldwide cash or debt is available in the locations in which it is needed.
FINANCIAL CONDITION (Sources and Uses of Cash)
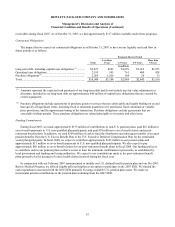
Our total cash and cash equivalents declined approximately 31% to $11.3 billion at October 31, 2007 from $16.4 billion
at October 31, 2006 due primarily to increased spending for repurchases of our common stock and investment spending on
acquisitions, which spending was partially offset by positive operating cash flows and increased borrowings. The net
$14.7 billion used for investing and financing activities during fiscal 2007 included $10.9 billion for share repurchases,
$6.8 billion for cash payments in connection with acquisitions and $2.5 billion for net investments in property, plant and
equipment. Partially offsetting these cash expenditures were $3.1 billion of proceeds relating to the issuance of stock under
employee stock plans and a $2.6 billion net increase in our debt and commercial paper from increased borrowings. Our cash
position remains strong, and we believe our cash balances are sufficient to cover cash outlays expected in fiscal 2008
associated with additional stock repurchases, acquisitions, company bonus payments, and other operating cash requirements.
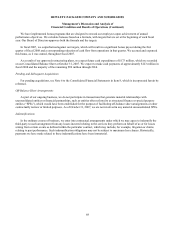
For the fiscal years ended October 31
2007 2006 2005
In millions
Net cash provided by operating activities......................................................................... $9,615 $11,353 $8,028
Net cash used in investing activities ................................................................................. (9,123) (2,787) (1,757)
Net cash used in financing activities................................................................................. (5,599) (6,077) (5,023)
Net (decrease) increase in cash and cash equivalents ....................................................... $(5,107) $2,489 $1,248
61


