HP 2007 Annual Report Download - page 70
Download and view the complete annual report
Please find page 70 of the 2007 HP annual report below. You can navigate through the pages in the report by either clicking on the pages listed below, or by using the keyword search tool below to find specific information within the annual report.-
 1
1 -
2
-
3
-
4
-
5
-
6
-
7
-
8
-
9
-
10
-
11
-
12
-
13
-
14
-
15
-
16
-
17
-
18
-
19
-
20
-
21
-
22
-
23
-
24
-
25
-
26
-
27
-
28
-
29
-
30
-
31
-
32
-
33
-
34
-
35
-
36
-
37
-
38
-
39
-
40
-
41
-
42
-
43
-
44
-
45
-
46
-
47
-
48
-
49
-
50
-
51
-
52
-
53
-
54
-
55
-
56
-
57
-
58
-
59
-
 60
60 -
 61
61 -
 62
62 -
 63
63 -
 64
64 -
 65
65 -
 66
66 -
 67
67 -
 68
68 -
 69
69 -
 70
70 -
 71
71 -
 72
72 -
 73
73 -
 74
74 -
 75
75 -
 76
76 -
 77
77 -
 78
78 -
 79
79 -
 80
80 -
81
-
82
-
83
-
84
-
85
-
86
-
87
-
88
-
89
-
90
-
91
-
92
-
93
-
94
-
95
-
96
-
97
-
98
-
99
-
100
-
101
-
102
-
103
-
104
-
105
-
106
-
107
-
108
-
109
-
110
-
111
-
112
-
113
-
114
-
115
-
116
-
117
-
118
-
119
-
120
-
121
-
122
-
123
-
124
-
125
-
126
-
127
-
128
-
129
-
130
-
131
-
132
-
133
-
134
-
135
-
136
-
137
-
138
-
139
-
140
-
141
-
142
-
143
-
144
-
145
-
146
-
147
-
148
-
149
-
150
-
151
-
152
-
153
-
154
-
155
-
156
-
157
-
158
-
159
-
160
-
161
-
162
-
163
-
164
-
165
-
166
-
167
-
168
-
169
-
170
-
171
-
172
-
173
-
174
-
175
-
176
-
177
-
178
-
179
-
180
 |
 |

HEWLETT-PACKARD COMPANY AND SUBSIDIARIES
Management’s Discussion and Analysis of
Financial Condition and Results of Operations (Continued)
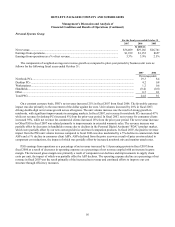
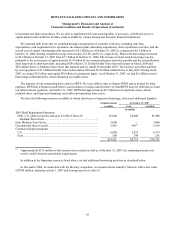
Personal Systems Group
For the fiscal years ended October 31
2007 2006 2005
In millions
Net revenue........................................................................................................................... $36,409 $29,166 $26,741
Earnings from operations...................................................................................................... $1,939 $1,152 $657
Earnings from operations as a % of net revenue................................................................... 5.3% 3.9% 2.5%
The components of weighted-average net revenue growth as compared to prior-year periods by business unit were as
follows for the following fiscal years ended October 31:
2007 2006
Percentage points
Notebook PCs............................................................................................................................................. 19.3 8.4
Desktop PCs ............................................................................................................................................... 4.2 0.8
Workstations............................................................................................................................................... 1.2 0.6
Handhelds ................................................................................................................................................... (0.4) (0.8)
Other ........................................................................................................................................................... 0.5 0.1
Total PSG ................................................................................................................................................... 24.8 9.1
On a constant currency basis, PSG’ s net revenue increased 21% in fiscal 2007 from fiscal 2006. The favorable currency
impact was due primarily to the movement of the dollar against the euro. Unit volumes increased by 28% in fiscal 2007,
driving double-digit net revenue growth across all regions. The unit volume increase was the result of strong growth in
notebooks, with significant improvements in emerging markets. In fiscal 2007, net revenue for notebook PCs increased 47%
while net revenue for desktop PCs increased 8% from the prior-year period. In fiscal 2007, net revenue for consumer clients
increased 39%, while net revenue for commercial clients increased 16% from the prior-year period. The net revenue increase
in Other PSG in fiscal 2007 was related primarily to improvements in extended warranty sales. The revenue increase was
partially offset by decreases in handhelds revenue due to declines in the Personal Digital Assistant (“PDA”) product market,
which were partially offset by our new converged device and travel companion products. In fiscal 2007, the positive revenue
impact from the PSG unit volume increase compared to fiscal 2006 was also moderated by a 5% decline in commercial client
ASPs and a 1% decline in consumer client ASPs. ASPs declined from the prior year was a result of price erosion related to
component cost reductions, the impact of which was partially offset by increased notebook mix and monitor attach rates.
PSG earnings from operations as a percentage of net revenue increased by 1.4 percentage points in fiscal 2007 from
fiscal 2006 as a result of decreases in operating expenses as a percentage of net revenue coupled with an increase in gross
margin. The increased gross margin was primarily a result of component cost declines and improvements in supply chain
costs per unit, the impact of which was partially offset by ASP declines. The operating expense decline as a percentage of net
revenue in fiscal 2007 was the result primarily of the increased net revenue and continued efforts to improve our cost
structure through efficiency measures.
56