HP 2007 Annual Report Download - page 76
Download and view the complete annual report
Please find page 76 of the 2007 HP annual report below. You can navigate through the pages in the report by either clicking on the pages listed below, or by using the keyword search tool below to find specific information within the annual report.-
 1
1 -
2
-
3
-
4
-
5
-
6
-
7
-
8
-
9
-
10
-
11
-
12
-
13
-
14
-
15
-
16
-
17
-
18
-
19
-
20
-
21
-
22
-
23
-
24
-
25
-
26
-
27
-
28
-
29
-
30
-
31
-
32
-
33
-
34
-
35
-
36
-
37
-
38
-
39
-
40
-
41
-
42
-
43
-
44
-
45
-
46
-
47
-
48
-
49
-
50
-
51
-
52
-
53
-
54
-
55
-
56
-
57
-
58
-
59
-
60
-
61
-
62
-
63
-
64
-
65
-
 66
66 -
 67
67 -
 68
68 -
 69
69 -
 70
70 -
 71
71 -
 72
72 -
 73
73 -
 74
74 -
 75
75 -
 76
76 -
 77
77 -
 78
78 -
 79
79 -
 80
80 -
 81
81 -
 82
82 -
 83
83 -
 84
84 -
 85
85 -
 86
86 -
87
-
88
-
89
-
90
-
91
-
92
-
93
-
94
-
95
-
96
-
97
-
98
-
99
-
100
-
101
-
102
-
103
-
104
-
105
-
106
-
107
-
108
-
109
-
110
-
111
-
112
-
113
-
114
-
115
-
116
-
117
-
118
-
119
-
120
-
121
-
122
-
123
-
124
-
125
-
126
-
127
-
128
-
129
-
130
-
131
-
132
-
133
-
134
-
135
-
136
-
137
-
138
-
139
-
140
-
141
-
142
-
143
-
144
-
145
-
146
-
147
-
148
-
149
-
150
-
151
-
152
-
153
-
154
-
155
-
156
-
157
-
158
-
159
-
160
-
161
-
162
-
163
-
164
-
165
-
166
-
167
-
168
-
169
-
170
-
171
-
172
-
173
-
174
-
175
-
176
-
177
-
178
-
179
-
180
 |
 |

HEWLETT-PACKARD COMPANY AND SUBSIDIARIES
Management’s Discussion and Analysis of
Financial Condition and Results of Operations (Continued)
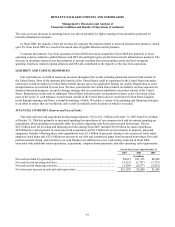
Key Performance Metrics
October 31
2007 2006 2005
Days of sales outstanding in accounts receivable .................................................................................... 43 40 39
Days of supply in inventory..................................................................................................................... 34 38 35
Days of purchases outstanding in accounts payable ................................................................................ (50) (59) (52)
Cash conversion cycle ............................................................................................................................. 27 19 22
Days of sales outstanding in accounts receivable (“DSO”) measures the average number of days our receivables are
outstanding. DSO is calculated by dividing accounts receivable, net of allowance for doubtful accounts, by a 90-day average
net revenue.
Days of supply in inventory (“DOS”) measures the average number of days from procurement to sale of our product.
DOS is calculated by dividing inventory by a 90-day average cost of goods sold.
Days of purchases outstanding in accounts payable (“DPO”) measures the average number of days our accounts payable
balances are outstanding. DPO is calculated by dividing accounts payable by a 90-day average cost of goods sold.
Our working capital requirements depend upon our effective management of the cash conversion cycle, which represents
effectively the number of days that elapse from the day we pay for the purchase of raw materials to the collection of cash
from our customers. The cash conversion cycle is the sum of DSO and DOS less DPO.
The increase in DSO was due primarily to selectively extending payment terms and reducing cash discount rates for
early payments for certain customers. The decrease in DOS was due primarily to more efficient inventory management and
higher cost of goods sold during the fourth quarter as a result of increased revenues. The decrease in DPO was due primarily
to purchasing linearity and reduced payment terms and cash discounts from our major contract manufacturers. These changes
contributed to the increase in our current year cash conversion cycle compared to the prior year.
2007 Compared to 2006
Operating Activities
Net cash provided by operating activities decreased by $1.7 billion during fiscal 2007 from fiscal 2006. The decrease
was due primarily to an increase in accounts receivable, a decrease in accounts payable and higher payments for bonuses
earned in fiscal 2006 and paid in the first quarter of fiscal 2007. The decease in our cash flow from operations was partially
offset by higher earnings in fiscal 2007.
Investing Activities
Net cash used in investing activities increased by $6.3 billion in fiscal 2007 from fiscal 2006, due primarily to higher
cash payments made in connection with acquisitions.
62