HP 2007 Annual Report Download - page 69
Download and view the complete annual report
Please find page 69 of the 2007 HP annual report below. You can navigate through the pages in the report by either clicking on the pages listed below, or by using the keyword search tool below to find specific information within the annual report.-
 1
1 -
2
-
3
-
4
-
5
-
6
-
7
-
8
-
9
-
10
-
11
-
12
-
13
-
14
-
15
-
16
-
17
-
18
-
19
-
20
-
21
-
22
-
23
-
24
-
25
-
26
-
27
-
28
-
29
-
30
-
31
-
32
-
33
-
34
-
35
-
36
-
37
-
38
-
39
-
40
-
41
-
42
-
43
-
44
-
45
-
46
-
47
-
48
-
49
-
50
-
51
-
52
-
53
-
54
-
55
-
56
-
57
-
58
-
 59
59 -
 60
60 -
 61
61 -
 62
62 -
 63
63 -
 64
64 -
 65
65 -
 66
66 -
 67
67 -
 68
68 -
 69
69 -
 70
70 -
 71
71 -
 72
72 -
 73
73 -
 74
74 -
 75
75 -
 76
76 -
 77
77 -
 78
78 -
 79
79 -
80
-
81
-
82
-
83
-
84
-
85
-
86
-
87
-
88
-
89
-
90
-
91
-
92
-
93
-
94
-
95
-
96
-
97
-
98
-
99
-
100
-
101
-
102
-
103
-
104
-
105
-
106
-
107
-
108
-
109
-
110
-
111
-
112
-
113
-
114
-
115
-
116
-
117
-
118
-
119
-
120
-
121
-
122
-
123
-
124
-
125
-
126
-
127
-
128
-
129
-
130
-
131
-
132
-
133
-
134
-
135
-
136
-
137
-
138
-
139
-
140
-
141
-
142
-
143
-
144
-
145
-
146
-
147
-
148
-
149
-
150
-
151
-
152
-
153
-
154
-
155
-
156
-
157
-
158
-
159
-
160
-
161
-
162
-
163
-
164
-
165
-
166
-
167
-
168
-
169
-
170
-
171
-
172
-
173
-
174
-
175
-
176
-
177
-
178
-
179
-
180
 |
 |

HEWLETT-PACKARD COMPANY AND SUBSIDIARIES
Management’s Discussion and Analysis of
Financial Condition and Results of Operations (Continued)
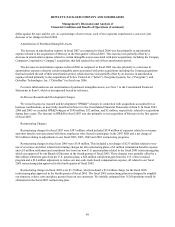
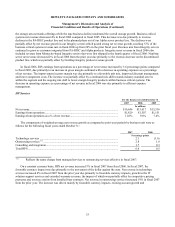
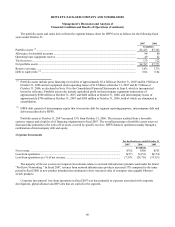
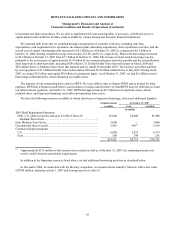
HP Software
For the fiscal years ended October 31
2007 2006 2005
In millions
Net revenue........................................................................................................................... $2,325 $1,301 $1,061
Earnings (loss) from operations ............................................................................................ $347 $85 $(49)
Earnings (loss) from operations as a % of net revenue......................................................... 14.9% 6.5% (4.6)%
On a constant currency basis, HP Software revenue increased 74% in fiscal 2007 as compared to fiscal 2006. The
favorable currency impact was due primarily to the movement of the dollar against the euro. Excluding the results of
Mercury, HP Software’ s revenue grew 5% in fiscal 2007. Net revenue associated with the acquisition of Mercury was
included in the results of OpenView, which increased 121% in fiscal 2007 and 15% in the same respective period without
Mercury. OpenView net revenue growth also was the result of increases in revenue from license and support contracts. Net
revenue for OpenCall, our telecommunications solutions product line, decreased 16% in fiscal 2007. The decrease in
OpenCall net revenue was due primarily to a platform shift that resulted in a transfer of the hardware revenue to ESS.
The operating margin improvement of 8.4 percentage points in fiscal 2007 as compared to fiscal 2006 was the result
primarily of an increase in gross margin and to a lesser degree a decrease in operating expense as a percentage of net revenue.
In fiscal 2007, the improvement in gross margin was a result of a favorable change in revenue mix driven by the inclusion of
revenue from Mercury licenses and support, which typically have a higher gross margin than the other offerings in the
segment, and to a lesser degree by more effective management of the support costs for OpenView and OpenCall. Operating
expense as a percentage of net revenue in fiscal 2007 decreased due primarily to cost controls and synergy savings from the
Mercury acquisition.
In fiscal 2006, Software net revenue increased 23% (8% excluding the impact of acquisitions and 24% on a constant
currency basis) from fiscal 2005. The unfavorable currency impact was due primarily to the movement of the dollar against
the euro and the yen for fiscal 2006. Peregrine, which HP acquired in December 2005, represented 14.7 percentage points of
HP Software’ s net revenue growth for fiscal 2006. Net revenue associated with the Peregrine acquisition is included in the
results of OpenView, our management solutions software product line, which represented 20 percentage points of growth on
a weighted-average net revenue basis for fiscal 2006. OpenCall contributed the remaining 3 percentage points of the
weighted-average net revenue increase for fiscal 2006. OpenView net revenue growth was the result of acquisitions and
increases in support and services contracts. OpenCall net revenue growth was the result of increased product sales and
licenses as well as larger contracts.
The operating margin improvement of 11.1 percentage points for fiscal 2006 from fiscal 2005 was the result primarily of
a decrease in operating expense as a percentage of net revenue and an increase in gross margin. The decrease in operating
expense as a percentage of net revenue was attributable to growth in field selling costs, research and development and
marketing expenses attributable to cost management efforts that was slower than revenue growth. These cost reductions were
partially offset by high integration costs associated with the acquisition of Peregrine as well as higher bonus accruals. The
improvement in gross margin was driven by an increase in revenue, more effective management of the support and services
costs for OpenView and OpenCall and from improved margins of our OpenCall product line resulting from a favorable
product mix shift towards higher margin products.
55