HP 2007 Annual Report Download - page 140
Download and view the complete annual report
Please find page 140 of the 2007 HP annual report below. You can navigate through the pages in the report by either clicking on the pages listed below, or by using the keyword search tool below to find specific information within the annual report.-
 1
1 -
2
-
3
-
4
-
5
-
6
-
7
-
8
-
9
-
10
-
11
-
12
-
13
-
14
-
15
-
16
-
17
-
18
-
19
-
20
-
21
-
22
-
23
-
24
-
25
-
26
-
27
-
28
-
29
-
30
-
31
-
32
-
33
-
34
-
35
-
36
-
37
-
38
-
39
-
40
-
41
-
42
-
43
-
44
-
45
-
46
-
47
-
48
-
49
-
50
-
51
-
52
-
53
-
54
-
55
-
56
-
57
-
58
-
59
-
60
-
61
-
62
-
63
-
64
-
65
-
66
-
67
-
68
-
69
-
70
-
71
-
72
-
73
-
74
-
75
-
76
-
77
-
78
-
79
-
80
-
81
-
82
-
83
-
84
-
85
-
86
-
87
-
88
-
89
-
90
-
91
-
92
-
93
-
94
-
95
-
96
-
97
-
98
-
99
-
100
-
101
-
102
-
103
-
104
-
105
-
106
-
107
-
108
-
109
-
110
-
111
-
112
-
113
-
114
-
115
-
116
-
117
-
118
-
119
-
120
-
121
-
122
-
123
-
124
-
125
-
126
-
127
-
128
-
129
-
 130
130 -
 131
131 -
 132
132 -
 133
133 -
 134
134 -
 135
135 -
 136
136 -
 137
137 -
 138
138 -
 139
139 -
 140
140 -
 141
141 -
 142
142 -
 143
143 -
 144
144 -
 145
145 -
 146
146 -
 147
147 -
 148
148 -
 149
149 -
 150
150 -
151
-
152
-
153
-
154
-
155
-
156
-
157
-
158
-
159
-
160
-
161
-
162
-
163
-
164
-
165
-
166
-
167
-
168
-
169
-
170
-
171
-
172
-
173
-
174
-
175
-
176
-
177
-
178
-
179
-
180
 |
 |

HEWLETT-PACKARD COMPANY AND SUBSIDIARIES
Notes to Consolidated Financial Statements (Continued)
Note 15: Retirement and Post-Retirement Benefit Plans (Continued)
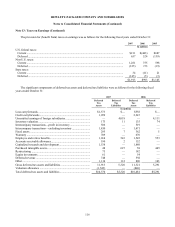
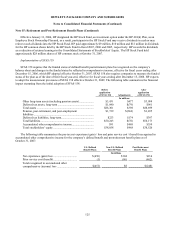
The following table summarizes the experience (gain) / loss and prior service cost / (benefit) that will be amortized from
accumulated other comprehensive income and recognized as components of net periodic benefit cost / (credit) during the next
fiscal year.
U.S. Defined
Benefit Plans
Non-U.S. Defined
Benefit Plans
Post-Retirement
Benefit Plans
In millions
Net experience (gain) loss ...................................................... $(36) $2 $19
Prior service cost (benefit)...................................................... — (8) (56)
Total recognized in accumulated other comprehensive (gain)
loss...................................................................................... $(36) $(6) $(37)
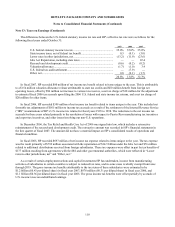
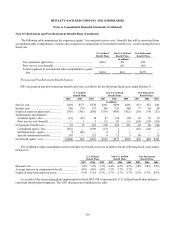
Pension and Post-Retirement Benefit Expense
HP’ s net pension and post-retirement benefit costs were as follows for the following fiscal years ended October 31:
U.S. Defined
Benefit Plans
Non-U.S. Defined
Benefit Plans
Post-Retirement
Benefit Plans
2007 2006 2005 2007 2006 2005 2007 2006 2005
In millions
Service cost............................................ $130 $177 $338 $261 $299 $236 $31 $32 $63
Interest cost............................................ 260 276 275 366 325 304 77 84 98
Expected return on plan assets............... (355) (361) (290) (579) (495) (412) (38) (34) (32)
Amortization and deferrals:
Actuarial (gain) / loss.......................... (13) (14) 38 87 136 104 26 39 35
Prior service cost (benefit).................. — 1 2 (7) (3) (1) (54) (55) (18)
Net periodic benefit cost........................ 22 79 363 128 262 231 42 66 146
Curtailment (gain) / loss...................... (541) — (199) (13) 1 — (26) (24) —
Settlement loss / (gain)........................ 8 (46) — 4 2 1 — — —
Special termination benefits................ 307 —352 412 3 60 —55
Net benefit (gain) / cost ......................... $(204) $33 $516 $123 $277 $235 $76 $42 $201
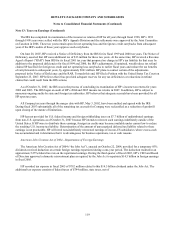
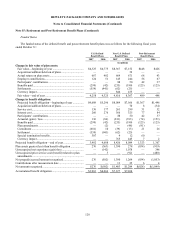
The weighted average assumptions used to calculate net benefit cost were as follows for the following fiscal years ended
October 31:
U.S. Defined
Benefit Plans
Non-U.S. Defined
Benefit Plans
Post-Retirement
Benefit Plans
2007 2006 2005 2007 2006 2005 2007 2006 2005
Discount rate................................................................. 5.9% 5.9% 5.7% 4.4% 4.2% 4.9% 5.8% 5.8% 5.6%
Average increase in compensation levels ..................... 4.0% 4.0% 4.0% 3.3% 3.7% 3.7% — — —
Expected long-term return on assets ............................. 8.3% 8.3% 8.3% 6.7% 6.7% 6.7% 8.3% 8.3% 8.3%
As a result of the restructuring plans implemented in fiscal 2007, HP re-measured its U.S. defined benefit plan and post-
retirement benefit plan obligations. The 2007 discount rates outlined in the table
126