HP 2007 Annual Report Download - page 60
Download and view the complete annual report
Please find page 60 of the 2007 HP annual report below. You can navigate through the pages in the report by either clicking on the pages listed below, or by using the keyword search tool below to find specific information within the annual report.-
 1
1 -
2
-
3
-
4
-
5
-
6
-
7
-
8
-
9
-
10
-
11
-
12
-
13
-
14
-
15
-
16
-
17
-
18
-
19
-
20
-
21
-
22
-
23
-
24
-
25
-
26
-
27
-
28
-
29
-
30
-
31
-
32
-
33
-
34
-
35
-
36
-
37
-
38
-
39
-
40
-
41
-
42
-
43
-
44
-
45
-
46
-
47
-
48
-
49
-
 50
50 -
 51
51 -
 52
52 -
 53
53 -
 54
54 -
 55
55 -
 56
56 -
 57
57 -
 58
58 -
 59
59 -
 60
60 -
 61
61 -
 62
62 -
 63
63 -
 64
64 -
 65
65 -
 66
66 -
 67
67 -
 68
68 -
 69
69 -
 70
70 -
71
-
72
-
73
-
74
-
75
-
76
-
77
-
78
-
79
-
80
-
81
-
82
-
83
-
84
-
85
-
86
-
87
-
88
-
89
-
90
-
91
-
92
-
93
-
94
-
95
-
96
-
97
-
98
-
99
-
100
-
101
-
102
-
103
-
104
-
105
-
106
-
107
-
108
-
109
-
110
-
111
-
112
-
113
-
114
-
115
-
116
-
117
-
118
-
119
-
120
-
121
-
122
-
123
-
124
-
125
-
126
-
127
-
128
-
129
-
130
-
131
-
132
-
133
-
134
-
135
-
136
-
137
-
138
-
139
-
140
-
141
-
142
-
143
-
144
-
145
-
146
-
147
-
148
-
149
-
150
-
151
-
152
-
153
-
154
-
155
-
156
-
157
-
158
-
159
-
160
-
161
-
162
-
163
-
164
-
165
-
166
-
167
-
168
-
169
-
170
-
171
-
172
-
173
-
174
-
175
-
176
-
177
-
178
-
179
-
180
 |
 |

HEWLETT-PACKARD COMPANY AND SUBSIDIARIES
Management’s Discussion and Analysis of
Financial Condition and Results of Operations (Continued)
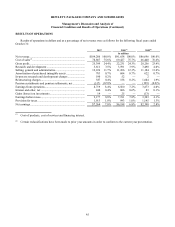
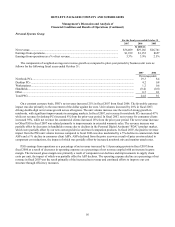
Net Revenue
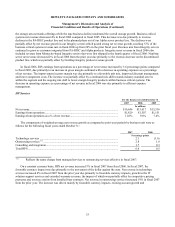
The components of weighted-average net revenue growth as compared to prior-year periods were as follows for the
following fiscal years ended October 31:
2007 2006
Percentage points
Personal Systems Group..................................................................................................................... 7.9 2.8
Imaging and Printing Group ............................................................................................................... 1.8 1.9
Enterprise Storage and Servers........................................................................................................... 1.6 0.7
HP Software........................................................................................................................................ 1.1 0.3
HP Services......................................................................................................................................... 1.1 0.1
HP Financial Services......................................................................................................................... 0.3 (0.1)
Corporate Investments/Other .............................................................................................................. — —
Total HP.............................................................................................................................................. 13.8 5.7
In fiscal 2007, HP net revenue increased approximately 14% from the prior year period (10% on a constant currency
basis). The favorable currency impact for fiscal 2007 was due primarily to the movement of the dollar against the euro. U.S.
net revenue was $34.8 billion for fiscal 2007, an increase of 8% from the prior year, while international net revenue increased
17% to $69.5 billion.
PSG had double-digit net revenue growth across all regions as a result of overall unit volume increases of 28%. The unit
volume increases resulted from strong growth in notebooks with significant improvements in emerging markets. The impact
of these increases was partially offset by declines in average selling prices (“ASPs”) in commercial and consumer clients of
5% and 1%, respectively. IPG net revenue growth in fiscal 2007 was due mainly to increased unit volumes of printer supplies
resulting from the continued expansion of printer hardware placements and the strong performance of supplies for
color-related products. ESS net revenue growth during fiscal 2007 was the result primarily of strong blade revenue and unit
growth in our industry standard servers business, increased option attach rates in our ProLiant server line, continued strong
performance in mid-range EVA products, growth in commercial storage area networks and revenue increases from our
Integrity servers. The ESS growth was partially moderated by the revenue declines in our tape business, high-end arrays and
our PA-RISC and Alpha server product lines during fiscal 2007. The net revenue growth in HP Software during fiscal 2007
was due primarily to growth in our OpenView business as a result of the Mercury acquisition and increases in revenue from
license and support contracts. HPS net revenue during fiscal 2007 increased due primarily to favorable currency impacts,
revenue increases in outsourcing services driven by existing accounts growth and new business, and revenue increases in
consulting and integration associated with acquisitions made in fiscal 2007. The HPFS net revenue increase during fiscal
2007 was due primarily to operating lease growth and higher end-of-lease activity.
In fiscal 2006, HP net revenue increased approximately 6% from the prior year period (7% on a constant currency basis).
The unfavorable currency impact for fiscal 2006 was due primarily to the movement of the dollar against the euro and the
yen. U.S. net revenue was $32.2 billion for fiscal 2006, an increase of 6% from the prior year, while international net revenue
increased 6% to $59.4 billion.
PSG net revenue increased across all regions as a result of a 15% volume increase. The volume increase resulted from
strong growth in consumer and commercial markets and significant improvement in emerging markets, which was partially
offset by 6% and 7% declines in ASPs in consumer and
46