HP 2007 Annual Report Download - page 68
Download and view the complete annual report
Please find page 68 of the 2007 HP annual report below. You can navigate through the pages in the report by either clicking on the pages listed below, or by using the keyword search tool below to find specific information within the annual report.-
 1
1 -
2
-
3
-
4
-
5
-
6
-
7
-
8
-
9
-
10
-
11
-
12
-
13
-
14
-
15
-
16
-
17
-
18
-
19
-
20
-
21
-
22
-
23
-
24
-
25
-
26
-
27
-
28
-
29
-
30
-
31
-
32
-
33
-
34
-
35
-
36
-
37
-
38
-
39
-
40
-
41
-
42
-
43
-
44
-
45
-
46
-
47
-
48
-
49
-
50
-
51
-
52
-
53
-
54
-
55
-
56
-
57
-
 58
58 -
 59
59 -
 60
60 -
 61
61 -
 62
62 -
 63
63 -
 64
64 -
 65
65 -
 66
66 -
 67
67 -
 68
68 -
 69
69 -
 70
70 -
 71
71 -
 72
72 -
 73
73 -
 74
74 -
 75
75 -
 76
76 -
 77
77 -
 78
78 -
79
-
80
-
81
-
82
-
83
-
84
-
85
-
86
-
87
-
88
-
89
-
90
-
91
-
92
-
93
-
94
-
95
-
96
-
97
-
98
-
99
-
100
-
101
-
102
-
103
-
104
-
105
-
106
-
107
-
108
-
109
-
110
-
111
-
112
-
113
-
114
-
115
-
116
-
117
-
118
-
119
-
120
-
121
-
122
-
123
-
124
-
125
-
126
-
127
-
128
-
129
-
130
-
131
-
132
-
133
-
134
-
135
-
136
-
137
-
138
-
139
-
140
-
141
-
142
-
143
-
144
-
145
-
146
-
147
-
148
-
149
-
150
-
151
-
152
-
153
-
154
-
155
-
156
-
157
-
158
-
159
-
160
-
161
-
162
-
163
-
164
-
165
-
166
-
167
-
168
-
169
-
170
-
171
-
172
-
173
-
174
-
175
-
176
-
177
-
178
-
179
-
180
 |
 |
HEWLETT-PACKARD COMPANY AND SUBSIDIARIES
Management’s Discussion and Analysis of
Financial Condition and Results of Operations (Continued)
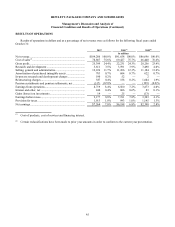
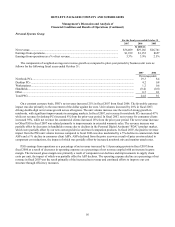
new business, which were partially offset by installed base revenue erosion and pricing pressures. Net revenue in consulting
and integration increased 9% in fiscal 2007 from the prior year due mainly to acquisitions made in fiscal 2007 and favorable
currency impacts.
HPS earnings from operations as a percentage of net revenue in fiscal 2007 increased by 1.4 percentage points. The
operating margin increase was the result of an increase in gross margin and a decrease in operating expenses as a percentage
of net revenue. The gross margin increase in fiscal 2007 was due primarily to the continued focus on cost structure
improvements generated by delivery efficiencies and cost controls, the impact of which was partially offset by the impact
from the continued competitive pricing environment. In fiscal 2007, continued efficiency improvements in our operating
expense structure contributed to the decline in operating expenses as a percentage of net revenue compared to the prior year.
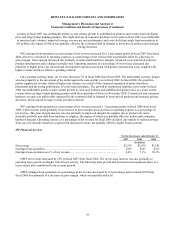
Technology services operating margin in fiscal 2007 continued to benefit from improved delivery efficiencies and cost
controls, the impact of which was offset in part by the impact of the ongoing portfolio mix shift from higher margin
proprietary support to lower margin areas such as IT solution services. Outsourcing services operating margin increased in
fiscal 2007 due primarily to improved delivery efficiencies and reduced operating expenses partially offset by contractual
pricing pressure. Consulting and integration operating margin decreased in fiscal 2007 due mainly to increased customer
project losses and acquisition related costs, the impact of which was partially offset by more efficient utilization of our
consultants and operating expense improvement.
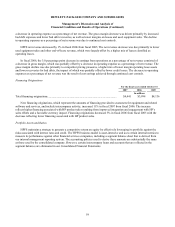
On a constant currency basis, HPS net revenue increased 2% in fiscal 2006 from fiscal 2005. In fiscal 2006, the
unfavorable currency impact was due primarily to the movement of the dollar against the euro and the yen. Net revenue in
technology services decreased 3% in fiscal 2006 from the prior year due primarily to declines related to competitive pricing
pressures and changes in the mix of platforms being serviced. In fiscal 2006, the 7% growth in outsourcing services net
revenue from the prior year was driven mainly by new business and existing account growth, with continued focus on making
more strategic portfolio decisions to improve profitability. Net revenue in consulting and integration increased 2% in fiscal
2006 from the prior year due primarily to improved performance in Asia Pacific and Europe, Middle East and Africa.
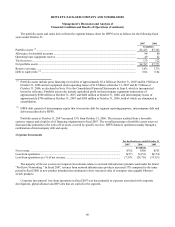
HPS earnings from operations as a percentage of net revenue in fiscal 2006 increased by 2.2 percentage points. The
operating margin increase was the result of a combination of an increase in gross margin and a decrease in operating
expenses as a percentage of net revenue. The gross margin increase in HPS was due primarily to the continued focus on cost
structure improvement from delivery efficiencies and cost controls, the impact of which was partially offset by the continued
competitive environment in solutions and services business and higher fiscal 2006 bonus accruals. In fiscal 2006, improved
efficiencies in our operating expense structure contributed to the decline in operating expenses as a percentage of net revenue
compared to fiscal year 2005 despite the impact of higher bonus accruals in fiscal 2006. Technology services operating
margin in fiscal 2006 continued to benefit from improved delivery efficiencies and cost controls as well as portfolio decisions
made to improve profitability, all of which benefit was offset in part by the impact of the ongoing portfolio mix shift from
higher margin proprietary support to lower margin areas such as solution services. Outsourcing services operating margin
increased in fiscal 2006 due to delivery efficiencies, reduced operating expenses and more strategic portfolio decisions made
to improve profitability. Consulting and integration operating margin improved in fiscal 2006 due to more efficient utilization
of our consultants and reduced operating expenses.
54