HP 2007 Annual Report Download - page 72
Download and view the complete annual report
Please find page 72 of the 2007 HP annual report below. You can navigate through the pages in the report by either clicking on the pages listed below, or by using the keyword search tool below to find specific information within the annual report.-
 1
1 -
2
-
3
-
4
-
5
-
6
-
7
-
8
-
9
-
10
-
11
-
12
-
13
-
14
-
15
-
16
-
17
-
18
-
19
-
20
-
21
-
22
-
23
-
24
-
25
-
26
-
27
-
28
-
29
-
30
-
31
-
32
-
33
-
34
-
35
-
36
-
37
-
38
-
39
-
40
-
41
-
42
-
43
-
44
-
45
-
46
-
47
-
48
-
49
-
50
-
51
-
52
-
53
-
54
-
55
-
56
-
57
-
58
-
59
-
60
-
61
-
 62
62 -
 63
63 -
 64
64 -
 65
65 -
 66
66 -
 67
67 -
 68
68 -
 69
69 -
 70
70 -
 71
71 -
 72
72 -
 73
73 -
 74
74 -
 75
75 -
 76
76 -
 77
77 -
 78
78 -
 79
79 -
 80
80 -
 81
81 -
 82
82 -
83
-
84
-
85
-
86
-
87
-
88
-
89
-
90
-
91
-
92
-
93
-
94
-
95
-
96
-
97
-
98
-
99
-
100
-
101
-
102
-
103
-
104
-
105
-
106
-
107
-
108
-
109
-
110
-
111
-
112
-
113
-
114
-
115
-
116
-
117
-
118
-
119
-
120
-
121
-
122
-
123
-
124
-
125
-
126
-
127
-
128
-
129
-
130
-
131
-
132
-
133
-
134
-
135
-
136
-
137
-
138
-
139
-
140
-
141
-
142
-
143
-
144
-
145
-
146
-
147
-
148
-
149
-
150
-
151
-
152
-
153
-
154
-
155
-
156
-
157
-
158
-
159
-
160
-
161
-
162
-
163
-
164
-
165
-
166
-
167
-
168
-
169
-
170
-
171
-
172
-
173
-
174
-
175
-
176
-
177
-
178
-
179
-
180
 |
 |

HEWLETT-PACKARD COMPANY AND SUBSIDIARIES
Management’s Discussion and Analysis of
Financial Condition and Results of Operations (Continued)
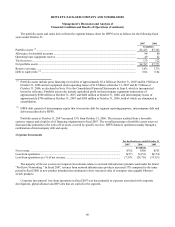
revenue in fiscal 2007 was attributable mainly to unit volume growth in multifunction printers and revenue from our digital
press and large format printing products. The slight increase in consumer hardware net revenue in fiscal 2007 was attributable
to increased unit volumes, improved average revenue per unit performance and a mix shift from single function products to
All-in-Ones, the impact of which was partially offset by the continued shift in demand to lower priced products and strategic
pricing decisions.
IPG earnings from operations as a percentage of net revenue increased by 0.3 percentage points in fiscal 2007 from fiscal
2006, driven by a decrease in operating expenses as a percentage of net revenue that was partially offset by a decrease in
gross margin. Gross margin decreased due primarily to unfavorable hardware margins, increased costs associated with new
product introductions and a change in product mix. Operating expenses as a percentage of net revenue decreased due
primarily to higher prior-year research and development expenses associated with product introduction costs, coupled with
higher revenue and more effective spending controls.
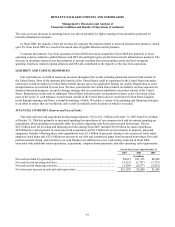
On a constant currency basis, net revenue increased 7% in fiscal 2006 from fiscal 2005. The unfavorable currency impact
was due primarily to the movement of the dollar against the euro and the yen in fiscal 2006. In fiscal 2006, the growth in
printer supplies net revenue reflected higher unit volumes as a result of the continued expansion of printer hardware
placements and the strong performance of color-related products. The growth in commercial hardware net revenue in fiscal
2006 was attributable mainly to unit volume growth in color laser printers and multifunction printers and, to a lesser extent,
revenue from our large format printing products with the acquisition of Scitex in November 2005. Commercial and consumer
hardware revenue was unfavorably impacted by the continued shift in demand to lower-priced products and strategic pricing
decisions, which caused average revenue per unit to decline.
IPG earnings from operations as a percentage of net revenue increased 1.3 percentage points in fiscal 2006 from fiscal
2005, which was the result primarily of an increase in gross margin and a decrease in operating expense as a percentage of
net revenue. The gross margin increase was due primarily to improved margins for supplies due to product mix and a
favorable portfolio mix shift from hardware to supplies, the impact of which was partially offset by unfavorable consumer
hardware margins. Operating expense as a percentage of net revenue for fiscal 2006 declined, due mainly to realized savings
from our cost structure initiatives coupled with increased revenue and partially offset by higher bonus accruals.
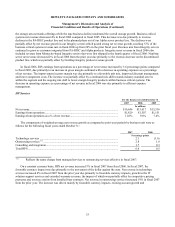
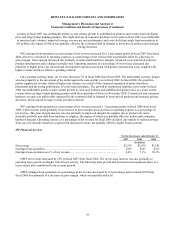
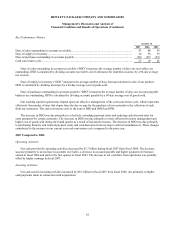
HP Financial Services
For the fiscal years ended October 31
2007 2006 2005
In millions
Net revenue.......................................................................................................................... $2,336 $2,078 $2,102
Earnings from operations..................................................................................................... $155 $147 $213
Earnings from operations as a % of net revenue.................................................................. 6.6% 7.1% 10.1%
HPFS net revenue increased by 12% in fiscal 2007 from fiscal 2006. The net revenue increase was due primarily to
operating lease growth and higher end-of-lease activity. The financing lease growth and increased used equipment sales, to a
lesser extent, also contributed to the revenue growth.
HPFS earnings from operations as a percentage of net revenue decreased by 0.5 percentage point in fiscal 2007 from
fiscal 2006 due primarily to a decrease in gross margin, which was partially offset by
58