HP 2007 Annual Report Download - page 164
Download and view the complete annual report
Please find page 164 of the 2007 HP annual report below. You can navigate through the pages in the report by either clicking on the pages listed below, or by using the keyword search tool below to find specific information within the annual report.-
 1
1 -
2
-
3
-
4
-
5
-
6
-
7
-
8
-
9
-
10
-
11
-
12
-
13
-
14
-
15
-
16
-
17
-
18
-
19
-
20
-
21
-
22
-
23
-
24
-
25
-
26
-
27
-
28
-
29
-
30
-
31
-
32
-
33
-
34
-
35
-
36
-
37
-
38
-
39
-
40
-
41
-
42
-
43
-
44
-
45
-
46
-
47
-
48
-
49
-
50
-
51
-
52
-
53
-
54
-
55
-
56
-
57
-
58
-
59
-
60
-
61
-
62
-
63
-
64
-
65
-
66
-
67
-
68
-
69
-
70
-
71
-
72
-
73
-
74
-
75
-
76
-
77
-
78
-
79
-
80
-
81
-
82
-
83
-
84
-
85
-
86
-
87
-
88
-
89
-
90
-
91
-
92
-
93
-
94
-
95
-
96
-
97
-
98
-
99
-
100
-
101
-
102
-
103
-
104
-
105
-
106
-
107
-
108
-
109
-
110
-
111
-
112
-
113
-
114
-
115
-
116
-
117
-
118
-
119
-
120
-
121
-
122
-
123
-
124
-
125
-
126
-
127
-
128
-
129
-
130
-
131
-
132
-
133
-
134
-
135
-
136
-
137
-
138
-
139
-
140
-
141
-
142
-
143
-
144
-
145
-
146
-
147
-
148
-
149
-
150
-
151
-
152
-
153
-
 154
154 -
 155
155 -
 156
156 -
 157
157 -
 158
158 -
 159
159 -
 160
160 -
 161
161 -
 162
162 -
 163
163 -
 164
164 -
 165
165 -
 166
166 -
 167
167 -
 168
168 -
 169
169 -
 170
170 -
 171
171 -
 172
172 -
 173
173 -
 174
174 -
175
-
176
-
177
-
178
-
179
-
180
 |
 |

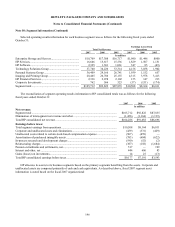
HEWLETT-PACKARD COMPANY AND SUBSIDIARIES
Quarterly Summary
(Unaudited)
Three-month periods ended
January 31 April 30 July 31 October 31
In millions, except per share amounts
2007
Net revenue........................................................................................................................................... $25,082 $25,534 $25,377 $28,293
Cost of sales(1) ....................................................................................................................................... 19,136 19,283 19,164 21,304
Research and development ................................................................................................................... 877 903 917 914
Selling, general and administrative ...................................................................................................... 2,908 3,044 3,002 3,272
Amortization of purchased intangible assets........................................................................................ 201 212 183 187
In-process research and development charges .....................................................................................167 19 — 4
Restructuring......................................................................................................................................... (41) 453 (5) (20)
Pension curtailments and pension settlements, net...............................................................................(9) (508) — —
Total costs and expenses....................................................................................................................... 23,239 23,406 23,261 25,661
Earnings from operations...................................................................................................................... 1,843 2,128 2,116 2,632
Interest and other, net ........................................................................................................................... 111 87 165 81
Gains (losses) on investments............................................................................................................... 10 13 5(14)
Earnings before taxes............................................................................................................................ 1,964 2,228 2,286 2,699
Provision for taxes ................................................................................................................................ 417 453 508 535
Net earnings .......................................................................................................................................... $1,547 $1,775 $1,778 $2,164
Net earnings per share:(2)
Basic ................................................................................................................................................. $0.57 $0.67 $0.68 $0.84
Diluted .............................................................................................................................................. $0.55 $0.65 $0.66 $0.81
Cash dividends paid per share .............................................................................................................. $0.08 $0.08 $0.08 $0.08
Range of per share closing stock prices on the New York Stock Exchange
Low................................................................................................................................................... $38.22 $38.67 $42.83 $46.01
High .................................................................................................................................................. $43.53 $43.13 $48.54 $52.87
2006
Net revenue........................................................................................................................................... $22,659 $22,554 $21,890 $24,555
Cost of sales(1) ....................................................................................................................................... 17,392 16,970 16,472 18,593
Research and development ................................................................................................................... 871 930 920 870
Selling, general and administrative ...................................................................................................... 2,692 2,858 2,830 2,886
Amortization of purchased intangible assets........................................................................................ 147 151 153 153
In-process research and development charges .....................................................................................50 2 — —
Restructuring......................................................................................................................................... 15 (14) 5152
Total costs and expenses....................................................................................................................... 21,167 20,897 20,380 22,654
Earnings from operations...................................................................................................................... 1,492 1,657 1,510 1,901
Interest and other, net ........................................................................................................................... 38 157 221 190
(Losses) gains on investments .............................................................................................................. (2) 6 714
Earnings before taxes............................................................................................................................ 1,528 1,820 1,738 2,105
Provision for (benefit from) taxes ........................................................................................................ 301 (79) 363 408
Net earnings .......................................................................................................................................... $1,227 $1,899 $1,375 $1,697
Net earnings per share:(2)
Basic ................................................................................................................................................. $0.43 $0.68 $0.50 $0.62
Diluted .............................................................................................................................................. $0.42 $0.66 $0.48 $0.60
Cash dividends paid per share .............................................................................................................. $0.08 $0.08 $0.08 $0.08
Range of per share closing stock prices on the New York Stock Exchange and Nasdaq Stock
Market:
Low................................................................................................................................................... $28.12 $30.27 $29.79 $31.67
High .................................................................................................................................................. $32.24 $34.36 $33.87 $39.87
(1) Cost of products, cost of services and financing interest.
(2) EPS for each quarter is computed using the weighted-average number of shares outstanding during that quarter, while
EPS for the fiscal year is computed using the weighted-average number of shares outstanding during the year. Thus, the
sum of the EPS for each of the four quarters may not equal the EPS for the fiscal year.
150