HP 2007 Annual Report Download - page 161
Download and view the complete annual report
Please find page 161 of the 2007 HP annual report below. You can navigate through the pages in the report by either clicking on the pages listed below, or by using the keyword search tool below to find specific information within the annual report.-
 1
1 -
2
-
3
-
4
-
5
-
6
-
7
-
8
-
9
-
10
-
11
-
12
-
13
-
14
-
15
-
16
-
17
-
18
-
19
-
20
-
21
-
22
-
23
-
24
-
25
-
26
-
27
-
28
-
29
-
30
-
31
-
32
-
33
-
34
-
35
-
36
-
37
-
38
-
39
-
40
-
41
-
42
-
43
-
44
-
45
-
46
-
47
-
48
-
49
-
50
-
51
-
52
-
53
-
54
-
55
-
56
-
57
-
58
-
59
-
60
-
61
-
62
-
63
-
64
-
65
-
66
-
67
-
68
-
69
-
70
-
71
-
72
-
73
-
74
-
75
-
76
-
77
-
78
-
79
-
80
-
81
-
82
-
83
-
84
-
85
-
86
-
87
-
88
-
89
-
90
-
91
-
92
-
93
-
94
-
95
-
96
-
97
-
98
-
99
-
100
-
101
-
102
-
103
-
104
-
105
-
106
-
107
-
108
-
109
-
110
-
111
-
112
-
113
-
114
-
115
-
116
-
117
-
118
-
119
-
120
-
121
-
122
-
123
-
124
-
125
-
126
-
127
-
128
-
129
-
130
-
131
-
132
-
133
-
134
-
135
-
136
-
137
-
138
-
139
-
140
-
141
-
142
-
143
-
144
-
145
-
146
-
147
-
148
-
149
-
150
-
 151
151 -
 152
152 -
 153
153 -
 154
154 -
 155
155 -
 156
156 -
 157
157 -
 158
158 -
 159
159 -
 160
160 -
 161
161 -
 162
162 -
 163
163 -
 164
164 -
 165
165 -
 166
166 -
 167
167 -
 168
168 -
 169
169 -
 170
170 -
 171
171 -
172
-
173
-
174
-
175
-
176
-
177
-
178
-
179
-
180
 |
 |

HEWLETT-PACKARD COMPANY AND SUBSIDIARIES
Notes to Consolidated Financial Statements (Continued)
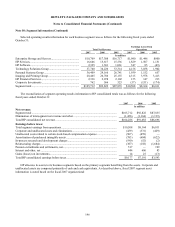
Note 18: Segment Information (Continued)
structure. Total assets by segment as well as for TSG and the reconciliation of segment assets to HP consolidated total assets
were as follows at October 31:
2007 2006 2005
In millions
Enterprise Storage and Servers............................................................................................. $13,518 $13,647 $13,591
HP Services........................................................................................................................... 17,232 15,712 15,381
HP Software.......................................................................................................................... 8,366 1,909 1,408
Technology Solutions Group ............................................................................................. $39,116 $31,268 $30,380
Personal Systems Group ....................................................................................................... 14,153 12,237 11,277
Imaging and Printing Group ................................................................................................. 14,573 13,889 13,523
HP Financial Services........................................................................................................... 9,001 7,927 7,856
Corporate Investments .......................................................................................................... 297 305 297
Corporate and unallocated assets.......................................................................................... 11,559 16,355 13,984
Total HP consolidated assets ................................................................................................ $88,699 $81,981 $77,317
Major Customers
No single customer represented 10% or more of HP’ s total net revenue in any fiscal year presented.
Geographic Information
Net revenue, classified by the major geographic areas in which HP operates, was as follows for the following fiscal years
ended October 31:
2007 2006 2005
In millions
Net revenue:
U.S......................................................................................................... $34,814 $32,244 $30,548
Non-U.S................................................................................................. 69,472 59,414 56,148
Total HP consolidated net revenue........................................................ $104,286 $91,658 $86,696
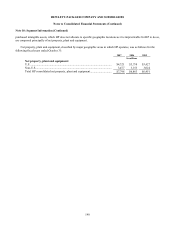
Net revenue by geographic area is based upon the sales location that predominately represents the customer location.
Other than the United States, no single country represented more than 10% of HP’ s total consolidated net revenue in any
period presented. HP reports revenue net of sales taxes, use taxes and value-added taxes directly imposed by governmental
authorities on HP’ s revenue producing transactions with its customers.
At October 31, 2007, no single country other than the United States had 10% or more of HP’ s total consolidated net
assets. At October 31, 2006, Belgium and the Netherlands each represented 10% or more of HP’ s total consolidated net assets
in addition to the United States. At October 31, 2005, no single country other than the United States had 10% or more of
HP’ s total consolidated net assets.
No single country other than the United States had more than 10% of HP’ s total consolidated net property, plant and
equipment in any period presented. HP’ s long-lived assets other than goodwill and
147