HP 2007 Annual Report Download - page 59
Download and view the complete annual report
Please find page 59 of the 2007 HP annual report below. You can navigate through the pages in the report by either clicking on the pages listed below, or by using the keyword search tool below to find specific information within the annual report.-
 1
1 -
2
-
3
-
4
-
5
-
6
-
7
-
8
-
9
-
10
-
11
-
12
-
13
-
14
-
15
-
16
-
17
-
18
-
19
-
20
-
21
-
22
-
23
-
24
-
25
-
26
-
27
-
28
-
29
-
30
-
31
-
32
-
33
-
34
-
35
-
36
-
37
-
38
-
39
-
40
-
41
-
42
-
43
-
44
-
45
-
46
-
47
-
48
-
 49
49 -
 50
50 -
 51
51 -
 52
52 -
 53
53 -
 54
54 -
 55
55 -
 56
56 -
 57
57 -
 58
58 -
 59
59 -
 60
60 -
 61
61 -
 62
62 -
 63
63 -
 64
64 -
 65
65 -
 66
66 -
 67
67 -
 68
68 -
 69
69 -
70
-
71
-
72
-
73
-
74
-
75
-
76
-
77
-
78
-
79
-
80
-
81
-
82
-
83
-
84
-
85
-
86
-
87
-
88
-
89
-
90
-
91
-
92
-
93
-
94
-
95
-
96
-
97
-
98
-
99
-
100
-
101
-
102
-
103
-
104
-
105
-
106
-
107
-
108
-
109
-
110
-
111
-
112
-
113
-
114
-
115
-
116
-
117
-
118
-
119
-
120
-
121
-
122
-
123
-
124
-
125
-
126
-
127
-
128
-
129
-
130
-
131
-
132
-
133
-
134
-
135
-
136
-
137
-
138
-
139
-
140
-
141
-
142
-
143
-
144
-
145
-
146
-
147
-
148
-
149
-
150
-
151
-
152
-
153
-
154
-
155
-
156
-
157
-
158
-
159
-
160
-
161
-
162
-
163
-
164
-
165
-
166
-
167
-
168
-
169
-
170
-
171
-
172
-
173
-
174
-
175
-
176
-
177
-
178
-
179
-
180
 |
 |

HEWLETT-PACKARD COMPANY AND SUBSIDIARIES
Management’s Discussion and Analysis of
Financial Condition and Results of Operations (Continued)
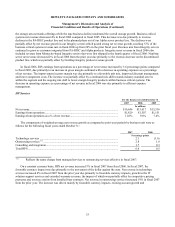
RESULTS OF OPERATIONS
Results of operations in dollars and as a percentage of net revenue were as follows for the following fiscal years ended
October 31:
2007 2006(2)
2005(2)
In millions
Net revenue............................................................................. $104,286 100.0% $91,658 100.0% $86,696 100.0%
Cost of sales(1)......................................................................... 78,887 75.6% 69,427 75.7% 66,440 76.6%
Gross profit ............................................................................. 25,399 24.4% 22,231 24.3% 20,256 23.4%
Research and development ..................................................... 3,611 3.5% 3,591 3.9% 3,490 4.0%
Selling, general and administrative......................................... 12,226 11.7% 11,266 12.3% 11,184 13.0%
Amortization of purchased intangible assets .......................... 783 0.7% 604 0.7% 622 0.7%
In-process research and development charges ........................ 190 0.2% 52 — 2 —
Restructuring charges ............................................................. 387 0.4% 158 0.2% 1,684 1.9%
Pension curtailments and pension settlements, net ................. (517) (0.5)% — — (199) (0.2)%
Earnings from operations........................................................ 8,719 8.4% 6,560 7.2% 3,473 4.0%
Interest and other, net ............................................................. 444 0.4% 606 0.6% 83 0.1%
Gains (losses) on investments................................................. 14 —25 — (13) —
Earnings before taxes.............................................................. 9,177 8.8% 7,191 7.8% 3,543 4.1%
Provision for taxes .................................................................. 1,913 1.8% 993 1.0% 1,145 1.3%
Net earnings............................................................................ $7,264 7.0% $6,198 6.8% $2,398 2.8%
(1) Cost of products, cost of services and financing interest.
(2) Certain reclassifications have been made to prior year amounts in order to conform to the current year presentation.
45