HP 2007 Annual Report Download - page 105
Download and view the complete annual report
Please find page 105 of the 2007 HP annual report below. You can navigate through the pages in the report by either clicking on the pages listed below, or by using the keyword search tool below to find specific information within the annual report.-
 1
1 -
2
-
3
-
4
-
5
-
6
-
7
-
8
-
9
-
10
-
11
-
12
-
13
-
14
-
15
-
16
-
17
-
18
-
19
-
20
-
21
-
22
-
23
-
24
-
25
-
26
-
27
-
28
-
29
-
30
-
31
-
32
-
33
-
34
-
35
-
36
-
37
-
38
-
39
-
40
-
41
-
42
-
43
-
44
-
45
-
46
-
47
-
48
-
49
-
50
-
51
-
52
-
53
-
54
-
55
-
56
-
57
-
58
-
59
-
60
-
61
-
62
-
63
-
64
-
65
-
66
-
67
-
68
-
69
-
70
-
71
-
72
-
73
-
74
-
75
-
76
-
77
-
78
-
79
-
80
-
81
-
82
-
83
-
84
-
85
-
86
-
87
-
88
-
89
-
90
-
91
-
92
-
93
-
94
-
 95
95 -
 96
96 -
 97
97 -
 98
98 -
 99
99 -
 100
100 -
 101
101 -
 102
102 -
 103
103 -
 104
104 -
 105
105 -
 106
106 -
 107
107 -
 108
108 -
 109
109 -
 110
110 -
 111
111 -
 112
112 -
 113
113 -
 114
114 -
 115
115 -
116
-
117
-
118
-
119
-
120
-
121
-
122
-
123
-
124
-
125
-
126
-
127
-
128
-
129
-
130
-
131
-
132
-
133
-
134
-
135
-
136
-
137
-
138
-
139
-
140
-
141
-
142
-
143
-
144
-
145
-
146
-
147
-
148
-
149
-
150
-
151
-
152
-
153
-
154
-
155
-
156
-
157
-
158
-
159
-
160
-
161
-
162
-
163
-
164
-
165
-
166
-
167
-
168
-
169
-
170
-
171
-
172
-
173
-
174
-
175
-
176
-
177
-
178
-
179
-
180
 |
 |

HEWLETT-PACKARD COMPANY AND SUBSIDIARIES
Notes to Consolidated Financial Statements (Continued)
Note 2: Stock-Based Compensation (Continued)
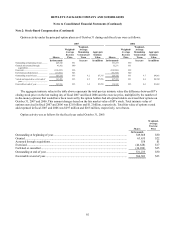
weighted-average grant date fair value of $45. In fiscal 2006, HP granted 33,000 shares of restricted stock units with a
weighted-average grant date fair value of $30. In fiscal 2005, HP granted 1,820,000 shares of restricted stock units with a
weighted-average grant date fair value of $21. HP had restricted stock units covering approximately 935,000 shares
outstanding at October 31, 2007, 873,000 shares outstanding at October 31, 2006 and 1,780,000 shares outstanding at
October 31, 2005.
In light of new accounting guidance under SFAS 123R, beginning in the second quarter of fiscal 2005 HP reevaluated its
assumptions used in estimating the fair value of employee options granted. As part of this assessment, management
determined that implied volatility calculated based on actively traded options on HP common stock is a better indicator of
expected volatility and future stock price trends than historical volatility. Therefore, expected volatility in fiscal 2007, 2006
and 2005 was based on a market-based implied volatility.
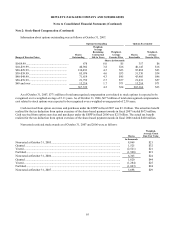
As part of its SFAS 123R adoption, HP also examined its historical pattern of option exercises in an effort to determine
if there were any discernable activity patterns based on certain employee populations. From this analysis, HP identified three
employee populations. HP used the Black-Scholes option pricing model to value the options for each of the employee
populations. The table below presents the weighted-average expected life in months of the combined three identified
employee populations. The expected life computation is based on historical exercise patterns and post-vesting termination
behavior within each of the three populations identified. The risk-free interest rate for periods within the contractual life of
the award is based on the U.S. Treasury yield curve in effect at the time of grant.
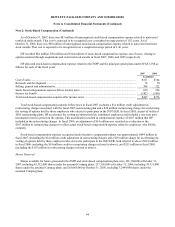
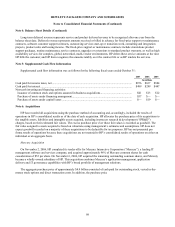
The fair value of share-based payment awards was estimated using the Black-Scholes option pricing model with the
following assumptions and weighted-average fair values:
Stock Options(1)
ESPP
2007 2006 2005 2005
Weighted-average fair value of grants.............................................................................. $13.01 $9.38 $5.63 $6.01
Risk-free interest rate........................................................................................................ 4.68% 4.35% 3.93% 2.66%
Dividend yield .................................................................................................................. 0.8% 1.0% 1.5% 1.6%
Expected volatility ............................................................................................................ 28% 29% 28% 30%
Expected life in months .................................................................................................... 59 57 54 6
(1) The fair value calculation was based on stock options granted during the period.
91