HP 2007 Annual Report Download - page 65
Download and view the complete annual report
Please find page 65 of the 2007 HP annual report below. You can navigate through the pages in the report by either clicking on the pages listed below, or by using the keyword search tool below to find specific information within the annual report.-
 1
1 -
2
-
3
-
4
-
5
-
6
-
7
-
8
-
9
-
10
-
11
-
12
-
13
-
14
-
15
-
16
-
17
-
18
-
19
-
20
-
21
-
22
-
23
-
24
-
25
-
26
-
27
-
28
-
29
-
30
-
31
-
32
-
33
-
34
-
35
-
36
-
37
-
38
-
39
-
40
-
41
-
42
-
43
-
44
-
45
-
46
-
47
-
48
-
49
-
50
-
51
-
52
-
53
-
54
-
 55
55 -
 56
56 -
 57
57 -
 58
58 -
 59
59 -
 60
60 -
 61
61 -
 62
62 -
 63
63 -
 64
64 -
 65
65 -
 66
66 -
 67
67 -
 68
68 -
 69
69 -
 70
70 -
 71
71 -
 72
72 -
 73
73 -
 74
74 -
 75
75 -
76
-
77
-
78
-
79
-
80
-
81
-
82
-
83
-
84
-
85
-
86
-
87
-
88
-
89
-
90
-
91
-
92
-
93
-
94
-
95
-
96
-
97
-
98
-
99
-
100
-
101
-
102
-
103
-
104
-
105
-
106
-
107
-
108
-
109
-
110
-
111
-
112
-
113
-
114
-
115
-
116
-
117
-
118
-
119
-
120
-
121
-
122
-
123
-
124
-
125
-
126
-
127
-
128
-
129
-
130
-
131
-
132
-
133
-
134
-
135
-
136
-
137
-
138
-
139
-
140
-
141
-
142
-
143
-
144
-
145
-
146
-
147
-
148
-
149
-
150
-
151
-
152
-
153
-
154
-
155
-
156
-
157
-
158
-
159
-
160
-
161
-
162
-
163
-
164
-
165
-
166
-
167
-
168
-
169
-
170
-
171
-
172
-
173
-
174
-
175
-
176
-
177
-
178
-
179
-
180
 |
 |
HEWLETT-PACKARD COMPANY AND SUBSIDIARIES
Management’s Discussion and Analysis of
Financial Condition and Results of Operations (Continued)
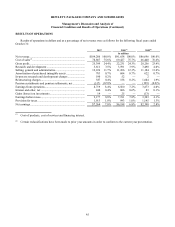
Gains (Losses) on Investments
Net gains on investment in fiscal 2007 and fiscal 2006 resulted primarily from gains on the sale of equity investments,
which were offset in part by impairment charges on our investment portfolio. Net losses in fiscal 2005 resulted primarily
from impairment charges on equity investments in our publicly-traded and privately-held investment portfolios. Partially
offsetting these losses were gains attributable to the sale of investments.
Provision for Taxes
Our effective tax rates were 20.8%, 13.8%, and 32.3% in fiscal 2007, 2006 and 2005, respectively.
The increase in the overall tax rate in fiscal 2007 from fiscal 2006 was related in part to favorable income tax
adjustments of $599 million recorded in fiscal 2006, which included net favorable tax adjustments of $565 million to income
tax accruals as a result of the settlement of IRS examinations of our U.S. income tax returns for fiscal years 1993 to 1998.
The reductions to the net income tax accruals for these years related primarily to the resolution of issues with respect to
Puerto Rico manufacturing tax incentives and export tax incentives, and other issues involving our non-U.S. operations.
In addition, the decrease in the overall tax rate in 2006 from fiscal 2005 was attributable in part to $697 million of
income tax expense related to items unique to fiscal 2005. The tax expense was the result primarily of $792 million
associated with the repatriation of $14.5 billion under the American Jobs Creation Act of 2004 (“Jobs Act”) and $76 million
related to additional distributions received from foreign subsidiaries. These tax expenses were offset in part by tax benefits
of $177 million resulting from agreements with the IRS and other governmental authorities. The Jobs Act, enacted on
October 22, 2004, provided for a temporary 85% dividend received deduction on certain foreign earnings repatriated during a
one-year period. The deduction resulted in an approximate 5.25% federal tax rate on the repatriated earnings.
For a full reconciliation of our effective tax rate to the U.S. federal statutory rate of 35% and further explanation of our
provision for taxes, see Note 13 to the Consolidated Financial Statements in Item 8, which is incorporated herein by
reference.
Segment Information
A description of the products and services, as well as financial data, for each segment can be found in Note 18 to the
Consolidated Financial Statements in Item 8, which is incorporated herein by reference. We have realigned segment financial
data for the fiscal years ended October 31, 2006 and 2005 to reflect changes in HP’ s organizational structure that occurred at
the beginning of the first quarter of fiscal 2007. We describe these changes more fully in Note 18 to the Consolidated
Financial Statements in Item 8. We have presented the business segments in this Annual Report on Form 10-K based on our
management organizational structure as of October 31, 2007 and the distinct nature of various businesses. Future changes to
this organizational structure may result in changes to the reportable segments disclosed. The discussions below include the
results of each of our segments.
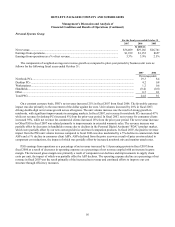
Technology Solutions Group
ESS, HPS and HP Software are structured beneath a broader Technology Solutions Group (“TSG”). We describe the
results of the business segments of TSG in more detail below.
51