HP 2007 Annual Report Download - page 74
Download and view the complete annual report
Please find page 74 of the 2007 HP annual report below. You can navigate through the pages in the report by either clicking on the pages listed below, or by using the keyword search tool below to find specific information within the annual report.-
 1
1 -
2
-
3
-
4
-
5
-
6
-
7
-
8
-
9
-
10
-
11
-
12
-
13
-
14
-
15
-
16
-
17
-
18
-
19
-
20
-
21
-
22
-
23
-
24
-
25
-
26
-
27
-
28
-
29
-
30
-
31
-
32
-
33
-
34
-
35
-
36
-
37
-
38
-
39
-
40
-
41
-
42
-
43
-
44
-
45
-
46
-
47
-
48
-
49
-
50
-
51
-
52
-
53
-
54
-
55
-
56
-
57
-
58
-
59
-
60
-
61
-
62
-
63
-
 64
64 -
 65
65 -
 66
66 -
 67
67 -
 68
68 -
 69
69 -
 70
70 -
 71
71 -
 72
72 -
 73
73 -
 74
74 -
 75
75 -
 76
76 -
 77
77 -
 78
78 -
 79
79 -
 80
80 -
 81
81 -
 82
82 -
 83
83 -
 84
84 -
85
-
86
-
87
-
88
-
89
-
90
-
91
-
92
-
93
-
94
-
95
-
96
-
97
-
98
-
99
-
100
-
101
-
102
-
103
-
104
-
105
-
106
-
107
-
108
-
109
-
110
-
111
-
112
-
113
-
114
-
115
-
116
-
117
-
118
-
119
-
120
-
121
-
122
-
123
-
124
-
125
-
126
-
127
-
128
-
129
-
130
-
131
-
132
-
133
-
134
-
135
-
136
-
137
-
138
-
139
-
140
-
141
-
142
-
143
-
144
-
145
-
146
-
147
-
148
-
149
-
150
-
151
-
152
-
153
-
154
-
155
-
156
-
157
-
158
-
159
-
160
-
161
-
162
-
163
-
164
-
165
-
166
-
167
-
168
-
169
-
170
-
171
-
172
-
173
-
174
-
175
-
176
-
177
-
178
-
179
-
180
 |
 |

HEWLETT-PACKARD COMPANY AND SUBSIDIARIES
Management’s Discussion and Analysis of
Financial Condition and Results of Operations (Continued)
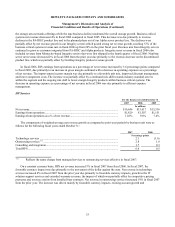
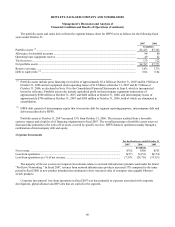
The portfolio assets and ratios derived from the segment balance sheet for HPFS were as follows for the following fiscal
years ended October 31:
2007 2006
In millions
Portfolio assets ‘(1) ......................................................................................................................................... $8,415 $7,345
Allowance for doubtful accounts.................................................................................................................. 84 80
Operating lease equipment reserve ............................................................................................................... 49 42
Total reserves................................................................................................................................................ 133 122
Net portfolio assets ....................................................................................................................................... $8,282 $7,223
Reserve coverage.......................................................................................................................................... 1.6% 1.7%
Debt to equity ratio ‘(2)................................................................................................................................... 6.0x 6.0x
‘(1) Portfolio assets include gross financing receivables of approximately $5.4 billion at October 31, 2007 and $4.9 billion at
October 31, 2006 and net equipment under operating leases of $1.8 billion at October 31, 2007 and $1.5 billion at
October 31, 2006, as disclosed in Note 10 to the Consolidated Financial Statements in Item 8, which is incorporated
herein by reference. Portfolio assets also include capitalized profit on intercompany equipment transactions of
approximately $500 million at October 31, 2007 and $400 million at October 31, 2006, and intercompany leases of
approximately $700 million at October 31, 2007 and $500 million at October 31, 2006, both of which are eliminated in
consolidation.
‘(2) HPFS debt consists of intercompany equity that is treated as debt for segment reporting purposes, intercompany debt and
debt issued directly by HPFS.
Portfolio assets at October 31, 2007 increased 15% from October 31, 2006. The increase resulted from a favorable
currency impact and a high level of financing originations in fiscal 2007. The overall percentage of portfolio assets reserved
decreased due primarily to the write-off of assets covered by specific reserves. HPFS funds its operations mainly through a
combination of intercompany debt and equity.
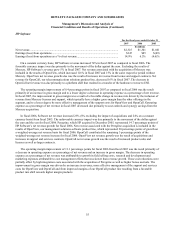
Corporate Investments
For the fiscal years ended October 31
2007 2006 2005
In millions
Net revenue.............................................................................................................................. $762 $566 $523
Loss from operations ............................................................................................................... $(57) $(151) $(174)
Loss from operations as a % of net revenue ............................................................................ (7.5)% (26.7)% (33.3)%
The majority of the net revenue in Corporate Investments relates to network infrastructure products sold under the brand
“ProCurve Networking.” In fiscal 2007, revenue from network infrastructure products increased 33% compared to the same
period in fiscal 2006 as new product introductions continued to drive increased sales of enterprise class gigabit Ethernet
switch products.
Corporate Investments’ loss from operations in fiscal 2007 was due primarily to expenses associated with corporate
development, global alliances and HP Labs that are carried in the segment.
60