HP 2005 Annual Report Download - page 90
Download and view the complete annual report
Please find page 90 of the 2005 HP annual report below. You can navigate through the pages in the report by either clicking on the pages listed below, or by using the keyword search tool below to find specific information within the annual report.-
 1
1 -
2
-
3
-
4
-
5
-
6
-
7
-
8
-
9
-
10
-
11
-
12
-
13
-
14
-
15
-
16
-
17
-
18
-
19
-
20
-
21
-
22
-
23
-
24
-
25
-
26
-
27
-
28
-
29
-
30
-
31
-
32
-
33
-
34
-
35
-
36
-
37
-
38
-
39
-
40
-
41
-
42
-
43
-
44
-
45
-
46
-
47
-
48
-
49
-
50
-
51
-
52
-
53
-
54
-
55
-
56
-
57
-
58
-
59
-
60
-
61
-
62
-
63
-
64
-
65
-
66
-
67
-
68
-
69
-
70
-
71
-
72
-
73
-
74
-
75
-
76
-
77
-
78
-
79
-
 80
80 -
 81
81 -
 82
82 -
 83
83 -
 84
84 -
 85
85 -
 86
86 -
 87
87 -
 88
88 -
 89
89 -
 90
90 -
 91
91 -
 92
92 -
 93
93 -
 94
94 -
 95
95 -
 96
96 -
 97
97 -
 98
98 -
 99
99 -
 100
100 -
101
-
102
-
103
-
104
-
105
-
106
-
107
-
108
-
109
-
110
-
111
-
112
-
113
-
114
-
115
-
116
-
117
-
118
-
119
-
120
-
121
-
122
-
123
-
124
-
125
-
126
-
127
-
128
-
129
-
130
-
131
-
132
-
133
-
134
-
135
-
136
-
137
-
138
-
139
-
140
-
141
-
142
-
143
-
144
-
145
-
146
-
147
-
148
-
149
-
150
-
151
-
152
-
153
-
154
-
155
 |
 |

HEWLETT-PACKARD COMPANY AND SUBSIDIARIES
Notes to Consolidated Financial Statements (Continued)
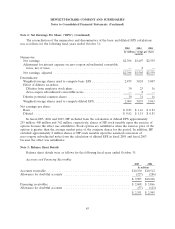
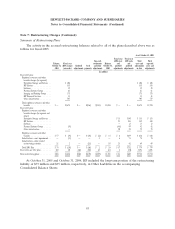
Note 3: Balance Sheet Details (Continued)
HP has revolving trade receivables-based facilities permitting us to sell certain trade receivables to
third parties on a non-recourse basis. The aggregate maximum capacity under these programs was
approximately $1.2 billion as of October 31, 2005. The facility with the largest volume is one that is
subject to a maximum amount of 525 million euros, approximately $630 million (the ‘‘Euro Program’’).
Trade receivables of approximately $7.9 billion were sold during fiscal 2005, including approximately
$5.4 billion under the Euro Program. Fees associated with these facilities do not generally differ
materially from the cash discounts previously offered to customers under other alternative prompt
payment programs. As of October 31, 2005, approximately $571 million was available under these
programs, of which $357 million relates to the Euro Program.
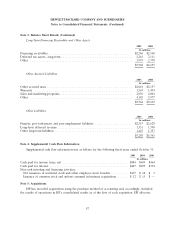
Inventory
2005 2004
In millions
Finished goods .................................................... $4,940 $5,322
Purchased parts and fabricated assemblies ................................ 1,937 1,749
$6,877 $7,071
Other Current Assets
2005 2004
In millions
Deferred tax assets—short term ....................................... $ 3,612 $3,744
Other receivables ................................................. 4,910 4,839
Prepaid and other current assets ...................................... 1,552 1,102
$10,074 $9,685
Property, Plant and Equipment
2005 2004
In millions
Land ......................................................... $ 629 $ 657
Buildings and leasehold improvements ................................. 5,630 5,752
Machinery and equipment .......................................... 7,621 7,427
13,880 13,836
Accumulated depreciation .......................................... (7,429) (7,187)
$ 6,451 $ 6,649
Depreciation expense was approximately $1.7 billion in fiscal 2005, $1.8 billion in fiscal 2004 and
$2.0 billion in fiscal 2003.
86