HP 2005 Annual Report Download - page 55
Download and view the complete annual report
Please find page 55 of the 2005 HP annual report below. You can navigate through the pages in the report by either clicking on the pages listed below, or by using the keyword search tool below to find specific information within the annual report.-
 1
1 -
2
-
3
-
4
-
5
-
6
-
7
-
8
-
9
-
10
-
11
-
12
-
13
-
14
-
15
-
16
-
17
-
18
-
19
-
20
-
21
-
22
-
23
-
24
-
25
-
26
-
27
-
28
-
29
-
30
-
31
-
32
-
33
-
34
-
35
-
36
-
37
-
38
-
39
-
40
-
41
-
42
-
43
-
44
-
 45
45 -
 46
46 -
 47
47 -
 48
48 -
 49
49 -
 50
50 -
 51
51 -
 52
52 -
 53
53 -
 54
54 -
 55
55 -
 56
56 -
 57
57 -
 58
58 -
 59
59 -
 60
60 -
 61
61 -
 62
62 -
 63
63 -
 64
64 -
 65
65 -
66
-
67
-
68
-
69
-
70
-
71
-
72
-
73
-
74
-
75
-
76
-
77
-
78
-
79
-
80
-
81
-
82
-
83
-
84
-
85
-
86
-
87
-
88
-
89
-
90
-
91
-
92
-
93
-
94
-
95
-
96
-
97
-
98
-
99
-
100
-
101
-
102
-
103
-
104
-
105
-
106
-
107
-
108
-
109
-
110
-
111
-
112
-
113
-
114
-
115
-
116
-
117
-
118
-
119
-
120
-
121
-
122
-
123
-
124
-
125
-
126
-
127
-
128
-
129
-
130
-
131
-
132
-
133
-
134
-
135
-
136
-
137
-
138
-
139
-
140
-
141
-
142
-
143
-
144
-
145
-
146
-
147
-
148
-
149
-
150
-
151
-
152
-
153
-
154
-
155
 |
 |

HEWLETT-PACKARD COMPANY AND SUBSIDIARIES
Management’s Discussion and Analysis of
Financial Condition and Results of Operations (Continued)
HPS net revenue increased 12% in fiscal 2004 compared to fiscal 2003. On a constant currency
basis, net revenue increased 5% in fiscal 2004. The favorable currency impact was due primarily to the
weakening of the dollar against the euro and the yen. The growth in technology services net revenue
was driven primarily by favorable currency impacts and the Triaton acquisition, as well as strength in
integrated support, desktop lifecycle and mission critical support solutions. In fiscal 2004, the growth in
managed services was due to increased net revenue from new large outsourcing deals and the
expansion of services to existing customers, as well as the Triaton acquisition. An increase in core
consulting and integration services contributed to a slight growth in the consulting and integration
business in fiscal 2004, while a decrease in sales of complementary third-party products negatively
impacted net revenue.
HPS earnings from operations as a percentage of net revenue declined 1.7 percentage points in
fiscal 2004, due in part to the continued growth in managed services, a lower-margin business,
becoming an increasingly larger part of HPS. Operating profit ratio declines in the managed services
and technology services business contributed to the overall segment operating profit ratio decline in
fiscal 2004.
Large outsourcing contracts at the early stages of their life cycle had lower margins in fiscal 2004,
causing the decline in the managed services operating profit ratio. In the technology services business,
competitive pricing pressures in both renewals and new contracts and a mix shift from higher margin
support agreements (e.g., Unix) to lower margin contracts (e.g., networking installations and
integrated multi-vendor support offerings) affected the technology services operating profit ratio, and to
a lesser degree, costs related to the integration of recent acquisitions also negatively affected
technology services operating profit ratio. The overall operating profit ratio decline was moderated
somewhat by an operating profit ratio improvement in the consulting and integration business as a
result of a sales force focus on HP’s Adaptive Enterprise offerings, customer relationship management
and continued process improvements.
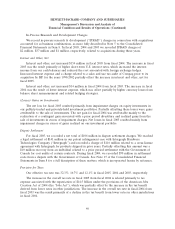
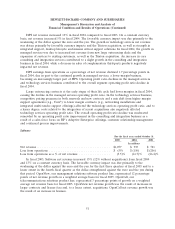
Software
For the fiscal years ended October 31
2005 2004 2003
In millions
Net revenue .......................................... $1,077 $ 933 $ 781
Loss from operations ................................... $ (59) $(156) $ (206)
Loss from operations as a % of net revenue .................. (5.5)% (16.7)% (26.4)%
In fiscal 2005, Software net revenue increased 15% (12% without acquisitions) from fiscal 2004
and 13% on a constant currency basis. The favorable currency impact was due primarily to the
weakening of the dollar against the euro and the yen for the first three quarters of fiscal 2005 and to a
lesser extent in the fourth fiscal quarter as the dollar strengthened against the euro and the yen during
that period. OpenView, our management solutions software product line, represented 12 percentage
points of net revenue growth on a weighted average basis for fiscal 2005. OpenCall, our
telecommunications solutions product line, represented 3 percentage points of growth on a weighted
average net revenue basis for fiscal 2005. OpenView net revenue growth was the result of increases in
larger contracts and license fees and, to a lesser extent, acquisitions. OpenCall net revenue growth was
the result of an increase in licenses.
51