HP 2005 Annual Report Download - page 58
Download and view the complete annual report
Please find page 58 of the 2005 HP annual report below. You can navigate through the pages in the report by either clicking on the pages listed below, or by using the keyword search tool below to find specific information within the annual report.-
 1
1 -
2
-
3
-
4
-
5
-
6
-
7
-
8
-
9
-
10
-
11
-
12
-
13
-
14
-
15
-
16
-
17
-
18
-
19
-
20
-
21
-
22
-
23
-
24
-
25
-
26
-
27
-
28
-
29
-
30
-
31
-
32
-
33
-
34
-
35
-
36
-
37
-
38
-
39
-
40
-
41
-
42
-
43
-
44
-
45
-
46
-
47
-
 48
48 -
 49
49 -
 50
50 -
 51
51 -
 52
52 -
 53
53 -
 54
54 -
 55
55 -
 56
56 -
 57
57 -
 58
58 -
 59
59 -
 60
60 -
 61
61 -
 62
62 -
 63
63 -
 64
64 -
 65
65 -
 66
66 -
 67
67 -
 68
68 -
69
-
70
-
71
-
72
-
73
-
74
-
75
-
76
-
77
-
78
-
79
-
80
-
81
-
82
-
83
-
84
-
85
-
86
-
87
-
88
-
89
-
90
-
91
-
92
-
93
-
94
-
95
-
96
-
97
-
98
-
99
-
100
-
101
-
102
-
103
-
104
-
105
-
106
-
107
-
108
-
109
-
110
-
111
-
112
-
113
-
114
-
115
-
116
-
117
-
118
-
119
-
120
-
121
-
122
-
123
-
124
-
125
-
126
-
127
-
128
-
129
-
130
-
131
-
132
-
133
-
134
-
135
-
136
-
137
-
138
-
139
-
140
-
141
-
142
-
143
-
144
-
145
-
146
-
147
-
148
-
149
-
150
-
151
-
152
-
153
-
154
-
155
 |
 |

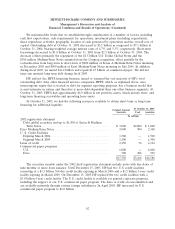
HEWLETT-PACKARD COMPANY AND SUBSIDIARIES
Management’s Discussion and Analysis of
Financial Condition and Results of Operations (Continued)
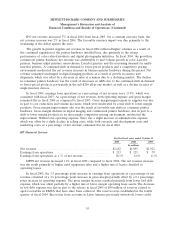
The gross margin decline were due primarily to continued competitive pressures in Europe, expansion
into developing markets and a shift towards lower-end products.
Imaging and Printing Group
For the fiscal years ended October 31
2005 2004 2003
In millions
Net revenue ........................................... $25,155 $24,199 $22,569
Earnings from operations ................................. $ 3,413 $ 3,843 $ 3,591
Earnings from operations as a % of net revenue ................ 13.6% 15.9% 15.9%
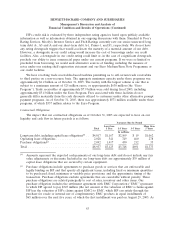
The components of weighted average net revenue growth, by business unit were as follows for the
following fiscal years ended October 31:
2005 2004
Percentage points
Supplies ......................................................... 3.4 5.3
Commercial hardware ............................................... 1.4 1.7
Consumer hardware ................................................. (0.7) (0.1)
Other ........................................................... (0.1) 0.3
Total IPG ........................................................ 4.0 7.2
IPG net revenue increased 4% in fiscal 2005 from fiscal 2004. On a constant currency basis, the
net revenue increase was 2% in fiscal 2005. The favorable currency impact was due primarily to the
weakening of the dollar against the euro and the yen for the first three quarters of fiscal 2005 and to a
lesser extent in the fourth fiscal quarter as the dollar strengthened against the euro and the yen during
that period.
For fiscal 2005, the growth in supplies net revenue was attributable primarily to unit growth in
LaserJet toner, due primarily to increased sales of color-related products. The growth in commercial
hardware net revenue in fiscal 2005 was attributable to unit volume growth in color LaserJet printers,
multifunction printers and the digital press business. New product introductions added to the net
revenue growth in multifunction printers. The effect of the commercial hardware volume increase was
offset partially by decreasing ASPs. For fiscal 2005, consumer hardware net revenue decreased. This
decline was the result of continuing decreases in ASPs due to strategic pricing actions, the continued
mix shift in demand to lower-priced products, intense competition in both the all-in-one and single
function inkjet printers and the ongoing decline in the scanner market.
For fiscal 2005, IPG earnings from operations as a percentage of net revenue declined by
2.3 percentage points due to a 2.4 percentage point decline in gross margin which was offset partially
by a 0.1 percentage point decline in operating expenses. The gross margin decline was attributable to a
mix shift within supplies from inkjet cartridges to LaserJet toner, a low-end mix shift in consumer
hardware, voluntary severance incentive charges and strategic pricing actions. Operating expense, as a
percentage of net revenue, remained relatively flat year-over-year, with a slight increase in spending
due to voluntary severance incentive charges taken in the first half of the fiscal year and the second
half of the year employee bonus expense offsetting the favorable impact of headcount reductions and
lower program spending in research and development.
54