HP 2005 Annual Report Download - page 45
Download and view the complete annual report
Please find page 45 of the 2005 HP annual report below. You can navigate through the pages in the report by either clicking on the pages listed below, or by using the keyword search tool below to find specific information within the annual report.-
 1
1 -
2
-
3
-
4
-
5
-
6
-
7
-
8
-
9
-
10
-
11
-
12
-
13
-
14
-
15
-
16
-
17
-
18
-
19
-
20
-
21
-
22
-
23
-
24
-
25
-
26
-
27
-
28
-
29
-
30
-
31
-
32
-
33
-
34
-
 35
35 -
 36
36 -
 37
37 -
 38
38 -
 39
39 -
 40
40 -
 41
41 -
 42
42 -
 43
43 -
 44
44 -
 45
45 -
 46
46 -
 47
47 -
 48
48 -
 49
49 -
 50
50 -
 51
51 -
 52
52 -
 53
53 -
 54
54 -
 55
55 -
56
-
57
-
58
-
59
-
60
-
61
-
62
-
63
-
64
-
65
-
66
-
67
-
68
-
69
-
70
-
71
-
72
-
73
-
74
-
75
-
76
-
77
-
78
-
79
-
80
-
81
-
82
-
83
-
84
-
85
-
86
-
87
-
88
-
89
-
90
-
91
-
92
-
93
-
94
-
95
-
96
-
97
-
98
-
99
-
100
-
101
-
102
-
103
-
104
-
105
-
106
-
107
-
108
-
109
-
110
-
111
-
112
-
113
-
114
-
115
-
116
-
117
-
118
-
119
-
120
-
121
-
122
-
123
-
124
-
125
-
126
-
127
-
128
-
129
-
130
-
131
-
132
-
133
-
134
-
135
-
136
-
137
-
138
-
139
-
140
-
141
-
142
-
143
-
144
-
145
-
146
-
147
-
148
-
149
-
150
-
151
-
152
-
153
-
154
-
155
 |
 |
HEWLETT-PACKARD COMPANY AND SUBSIDIARIES
Management’s Discussion and Analysis of
Financial Condition and Results of Operations (Continued)
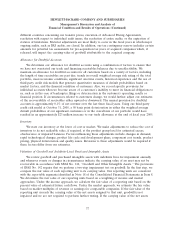
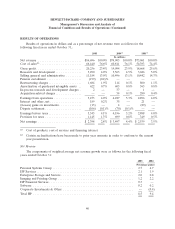
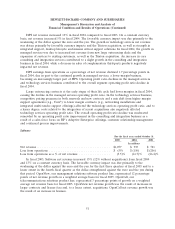
In fiscal 2005, HP net revenue increased approximately 8% from the prior year period (6% on a
constant currency basis). The favorable currency impact was due primarily to the weakening of the
dollar against the euro and the yen for the first three quarters of fiscal 2005 and to a lesser extent in
the fourth fiscal quarter as the dollar strengthened against the euro and the yen during that period.
U.S. net revenue was $30.5 billion for fiscal 2005, an increase of 4% from the prior year, while
international net revenue increased 11% to $56.2 billion.
In PSG, net revenue increased across all regions as a result of a 13% volume increase in consumer
and commercial clients. The volume increase was partially offset by a decline of 4% in average selling
prices (‘‘ASPs’’). Notebook PC sales were the leading contributor to net revenue growth in PSG. HPS
achieved net revenue growth across all businesses in fiscal 2005 due in large part to the impact of
acquisitions (primarily benefiting technology services) and favorable currency impacts. Additionally,
managed services net revenue increased due to both new contract signings and additional contract
revenue from the installed base. In fiscal 2005, ESS net revenue growth was the result primarily of
continued strong sales of industry standard servers, particularly our ProLiant server line, due to volume
increases and higher ASPs resulting from improved option attach rates. IPG net revenue growth in
fiscal 2005 was the result of increased unit growth of printer supplies, particularly LaserJet toner, as a
result of the increasing demand for color-related products. The demand for color-related products also
added to the revenue growth in commercial hardware. Both Software and HPFS contributed to HP net
revenue growth for fiscal 2005 as growing acceptance of our OpenView product offerings contributed to
Software revenue growth while higher used equipment sales and a higher mix of operating leases
benefited HPFS.
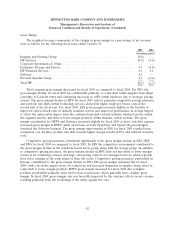
In fiscal 2004, HP net revenue increased 9% from the prior year period (3% on a constant
currency basis). The favorable currency impact was due primarily to the weakening of the dollar against
the euro. U.S. net revenue remained flat at $29.4 billion, while international net revenue increased 15%
to $50.5 billion compared to fiscal 2003.
PSG experienced net revenue growth across all businesses, with customer demand resulting in
significant volume increases in desktop and notebook PCs. The overall volume increase was offset by a
slight decline in the overall ASPs due to a mix shift to lower-end products as well as component cost
declines. IPG net revenue growth in fiscal 2004 was driven by the continued volume growth of printer
supplies. Toner supplies and color laser printers experienced strong volume growth due to the growing
demand for color-related products and digital photography. HPS achieved net revenue growth across all
businesses in fiscal 2004. The impact of major outsourcing deals and, to a lesser extent, the acquisition
of Triaton GmbH, Triaton France SAS and Triaton N.A., Inc. (USA) (collectively ‘‘Triaton’’) in the
second half of the year, contributed to the growth in managed services and technology services. In fiscal
2004, ESS net revenue growth was generated by sales of industry standard servers, primarily our
ProLiant server line. Revenue declines from competitive pressures in storage and business critical
servers moderated the overall ESS segment net revenue growth. The slight decrease in HPFS net
revenue for fiscal 2004 was due primarily to lower levels of revenue-generating assets.
41