HP 2005 Annual Report Download - page 77
Download and view the complete annual report
Please find page 77 of the 2005 HP annual report below. You can navigate through the pages in the report by either clicking on the pages listed below, or by using the keyword search tool below to find specific information within the annual report.-
 1
1 -
2
-
3
-
4
-
5
-
6
-
7
-
8
-
9
-
10
-
11
-
12
-
13
-
14
-
15
-
16
-
17
-
18
-
19
-
20
-
21
-
22
-
23
-
24
-
25
-
26
-
27
-
28
-
29
-
30
-
31
-
32
-
33
-
34
-
35
-
36
-
37
-
38
-
39
-
40
-
41
-
42
-
43
-
44
-
45
-
46
-
47
-
48
-
49
-
50
-
51
-
52
-
53
-
54
-
55
-
56
-
57
-
58
-
59
-
60
-
61
-
62
-
63
-
64
-
65
-
66
-
 67
67 -
 68
68 -
 69
69 -
 70
70 -
 71
71 -
 72
72 -
 73
73 -
 74
74 -
 75
75 -
 76
76 -
 77
77 -
 78
78 -
 79
79 -
 80
80 -
 81
81 -
 82
82 -
 83
83 -
 84
84 -
 85
85 -
 86
86 -
 87
87 -
88
-
89
-
90
-
91
-
92
-
93
-
94
-
95
-
96
-
97
-
98
-
99
-
100
-
101
-
102
-
103
-
104
-
105
-
106
-
107
-
108
-
109
-
110
-
111
-
112
-
113
-
114
-
115
-
116
-
117
-
118
-
119
-
120
-
121
-
122
-
123
-
124
-
125
-
126
-
127
-
128
-
129
-
130
-
131
-
132
-
133
-
134
-
135
-
136
-
137
-
138
-
139
-
140
-
141
-
142
-
143
-
144
-
145
-
146
-
147
-
148
-
149
-
150
-
151
-
152
-
153
-
154
-
155
 |
 |

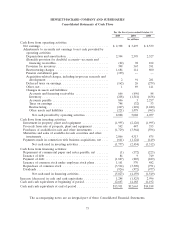
HEWLETT-PACKARD COMPANY AND SUBSIDIARIES
Consolidated Statements of Cash Flows
For the fiscal years ended October 31
2005 2004 2003
In millions
Cash flows from operating activities:
Net earnings ....................................... $ 2,398 $ 3,497 $ 2,539
Adjustments to reconcile net earnings to net cash provided by
operating activities:
Depreciation and amortization ........................ 2,344 2,395 2,527
(Benefit) provision for doubtful accounts—accounts and
financing receivables .............................. (22) 98 102
Provision for inventory .............................. 398 367 391
Restructuring charges .............................. 1,684 114 800
Pension curtailment gain ............................ (199) — —
Acquisition-related charges, including in-process research and
development ................................... 2 91 281
Deferred taxes on earnings ........................... (162) 26 (279)
Other, net ....................................... 1 89 141
Changes in assets and liabilities:
Accounts and financing receivables ................... 666 (696) 88
Inventory ...................................... (208) (1,341) (638)
Accounts payable ................................ 846 3 2,257
Taxes on earnings ................................ 748 (32) 53
Restructuring ................................... (247) (601) (1,240)
Other assets and liabilities ......................... (221) 1,078 (965)
Net cash provided by operating activities ............. 8,028 5,088 6,057
Cash flows from investing activities:
Investment in property, plant and equipment ............... (1,995) (2,126) (1,995)
Proceeds from sale of property, plant and equipment ......... 542 447 353
Purchases of available-for-sale and other investments ......... (1,729) (3,964) (596)
Maturities and sales of available-for-sale securities and other
investments ...................................... 2,066 4,313 875
Payments made in connection with business acquisitions, net .... (641) (1,124) (149)
Net cash used in investing activities ................. (1,757) (2,454) (1,512)
Cash flows from financing activities:
Repayment of commercial paper and notes payable, net ....... (1) (172) (223)
Issuance of debt .................................... 84 9 749
Payment of debt .................................... (1,827) (285) (829)
Issuance of common stock under employee stock plans ........ 1,161 570 482
Repurchase of common stock .......................... (3,514) (3,309) (751)
Dividends ......................................... (926) (972) (977)
Net cash used in financing activities ................. (5,023) (4,159) (1,549)
Increase (decrease) in cash and cash equivalents .............. 1,248 (1,525) 2,996
Cash and cash equivalents at beginning of period .............. 12,663 14,188 11,192
Cash and cash equivalents at end of period .................. $13,911 $12,663 $14,188
The accompanying notes are an integral part of these Consolidated Financial Statements.
73