HP 2005 Annual Report Download - page 13
Download and view the complete annual report
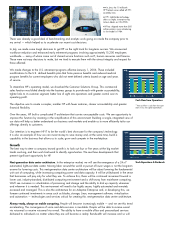
Please find page 13 of the 2005 HP annual report below. You can navigate through the pages in the report by either clicking on the pages listed below, or by using the keyword search tool below to find specific information within the annual report.-
 1
1 -
2
-
 3
3 -
 4
4 -
 5
5 -
 6
6 -
 7
7 -
 8
8 -
 9
9 -
 10
10 -
 11
11 -
 12
12 -
 13
13 -
 14
14 -
 15
15 -
 16
16 -
 17
17 -
 18
18 -
 19
19 -
 20
20 -
 21
21 -
 22
22 -
 23
23 -
24
-
25
-
26
-
27
-
28
-
29
-
30
-
31
-
32
-
33
-
34
-
35
-
36
-
37
-
38
-
39
-
40
-
41
-
42
-
43
-
44
-
45
-
46
-
47
-
48
-
49
-
50
-
51
-
52
-
53
-
54
-
55
-
56
-
57
-
58
-
59
-
60
-
61
-
62
-
63
-
64
-
65
-
66
-
67
-
68
-
69
-
70
-
71
-
72
-
73
-
74
-
75
-
76
-
77
-
78
-
79
-
80
-
81
-
82
-
83
-
84
-
85
-
86
-
87
-
88
-
89
-
90
-
91
-
92
-
93
-
94
-
95
-
96
-
97
-
98
-
99
-
100
-
101
-
102
-
103
-
104
-
105
-
106
-
107
-
108
-
109
-
110
-
111
-
112
-
113
-
114
-
115
-
116
-
117
-
118
-
119
-
120
-
121
-
122
-
123
-
124
-
125
-
126
-
127
-
128
-
129
-
130
-
131
-
132
-
133
-
134
-
135
-
136
-
137
-
138
-
139
-
140
-
141
-
142
-
143
-
144
-
145
-
146
-
147
-
148
-
149
-
150
-
151
-
152
-
153
-
154
-
155
 |
 |
price increases and limited availability of certain components that are not available from multiple
sources. Frequently, we are able to obtain scarce components for somewhat higher prices on the open
market, which may have an impact on gross margin but does not disrupt production. On occasion, we
acquire component inventory in anticipation of supply constraints or enter into longer-term pricing
commitments with vendors to improve the priority and availability of supply. See ‘‘Risk Factors—We
depend on third party suppliers, and our revenue and gross margin could suffer if we fail to manage
supplier issues properly,’’ in Item 1A, which is incorporated herein by reference.
International
Our products and services are available worldwide. We believe this geographic diversity allows us
to meet demand on a worldwide basis for both consumer and enterprise customers, draws on business
and technical expertise from a worldwide workforce, provides stability to our operations, allows us to
drive economies of scale, provides revenue streams to offset geographic economic trends and offers us
an opportunity to access new markets for maturing products. In addition, we believe that future growth
is dependent in part on our ability to develop products and sales models that target developing
countries. In this regard, we believe that our broad geographic presence gives us a solid base to build
upon for such future growth.
A summary of our domestic and international net revenue and net property, plant and equipment
is set forth in Note 18 to the Consolidated Financial Statements in Item 8, which is incorporated herein
by reference. Over 60% of our overall net revenue in fiscal 2005 came from outside the United States.
The majority of our net revenue originating outside the United States was from customers other than
foreign governments.
For a discussion of risks attendant to HP’s foreign operations, see ‘‘Risk Factors—Due to the
international nature of our business, political or economic changes or other factors could harm our
future revenue, costs and expenses and financial condition,’’ in Item 1A, ‘‘Quantitative and Qualitative
Disclosure about Market Risk’’ in Item 7A and Note 8 to the Consolidated Financial Statements in
Item 8, which are incorporated herein by reference.
Research and Development
We remain committed to innovation as a key element of HP’s culture. Our development efforts
are focused on designing and developing products, services and solutions that anticipate customers’
changing needs and desires and emerging technological trends. Our efforts also are focused on
identifying the areas where we believe we can make a unique contribution and the areas where
partnering with other leading technology companies will leverage our cost structure and maximize our
customers’ experiences.
HP Labs, together with the various research and development groups within the five principal
business segments, are responsible for our research and development efforts. HP Labs is part of our
Corporate Investments segment.
Expenditures for research and development in fiscal 2005 were $3.5 billion, as compared to
$3.6 billion in fiscal 2004 and $3.7 billion in fiscal 2003. We anticipate that we will continue to have
significant research and development expenditures in the future to provide a continuing flow of
innovative, high-quality products and services to maintain and enhance our competitive position.
For a discussion of risks attendant to our research and development activities, see ‘‘Risk Factors—
If we cannot continue to develop, manufacture and market products and services that meet customer
requirements for innovation and quality, our revenue may suffer,’’ in Item 1A, which is incorporated
herein by reference.
9