HP 2005 Annual Report Download - page 137
Download and view the complete annual report
Please find page 137 of the 2005 HP annual report below. You can navigate through the pages in the report by either clicking on the pages listed below, or by using the keyword search tool below to find specific information within the annual report.-
 1
1 -
2
-
3
-
4
-
5
-
6
-
7
-
8
-
9
-
10
-
11
-
12
-
13
-
14
-
15
-
16
-
17
-
18
-
19
-
20
-
21
-
22
-
23
-
24
-
25
-
26
-
27
-
28
-
29
-
30
-
31
-
32
-
33
-
34
-
35
-
36
-
37
-
38
-
39
-
40
-
41
-
42
-
43
-
44
-
45
-
46
-
47
-
48
-
49
-
50
-
51
-
52
-
53
-
54
-
55
-
56
-
57
-
58
-
59
-
60
-
61
-
62
-
63
-
64
-
65
-
66
-
67
-
68
-
69
-
70
-
71
-
72
-
73
-
74
-
75
-
76
-
77
-
78
-
79
-
80
-
81
-
82
-
83
-
84
-
85
-
86
-
87
-
88
-
89
-
90
-
91
-
92
-
93
-
94
-
95
-
96
-
97
-
98
-
99
-
100
-
101
-
102
-
103
-
104
-
105
-
106
-
107
-
108
-
109
-
110
-
111
-
112
-
113
-
114
-
115
-
116
-
117
-
118
-
119
-
120
-
121
-
122
-
123
-
124
-
125
-
126
-
 127
127 -
 128
128 -
 129
129 -
 130
130 -
 131
131 -
 132
132 -
 133
133 -
 134
134 -
 135
135 -
 136
136 -
 137
137 -
 138
138 -
 139
139 -
 140
140 -
 141
141 -
 142
142 -
 143
143 -
 144
144 -
 145
145 -
 146
146 -
 147
147 -
148
-
149
-
150
-
151
-
152
-
153
-
154
-
155
 |
 |

HEWLETT-PACKARD COMPANY AND SUBSIDIARIES
Notes to Consolidated Financial Statements (Continued)
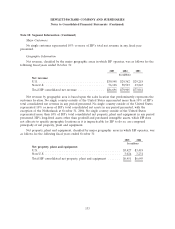
Note 18: Segment Information (Continued)
Major Customers
No single customer represented 10% or more of HP’s total net revenue in any fiscal year
presented.
Geographic Information
Net revenue, classified by the major geographic areas in which HP operates, was as follows for the
following fiscal years ended October 31:
2005 2004 2003
In millions
Net revenue:
U.S. ..................................... $30,548 $29,362 $29,218
Non-U.S. ................................. 56,148 50,543 43,843
Total HP consolidated net revenue ............... $86,696 $79,905 $73,061
Net revenue by geographic area is based upon the sales location that predominately represents the
customer location. No single country outside of the United States represented more than 10% of HP’s
total consolidated net revenue in any period presented. No single country outside of the United States
represented 10% or more of HP’s total consolidated net assets in any period presented, with the
exception of the Netherlands at October 31, 2004. No single country outside of the United States
represented more than 10% of HP’s total consolidated net property, plant and equipment in any period
presented. HP’s long-lived assets other than goodwill and purchased intangible assets, which HP does
not allocate to specific geographic locations as it is impracticable for HP to do so, are composed
principally of net property, plant and equipment.
Net property, plant and equipment, classified by major geographic areas in which HP operates, was
as follows for the following fiscal years ended October 31:
2005 2004
In millions
Net property, plant and equipment:
U.S. .............................................. $3,427 $3,418
Non-U.S. ........................................... 3,024 3,231
Total HP consolidated net property, plant and equipment ....... $6,451 $6,649
133