HP 2005 Annual Report Download - page 63
Download and view the complete annual report
Please find page 63 of the 2005 HP annual report below. You can navigate through the pages in the report by either clicking on the pages listed below, or by using the keyword search tool below to find specific information within the annual report.-
 1
1 -
2
-
3
-
4
-
5
-
6
-
7
-
8
-
9
-
10
-
11
-
12
-
13
-
14
-
15
-
16
-
17
-
18
-
19
-
20
-
21
-
22
-
23
-
24
-
25
-
26
-
27
-
28
-
29
-
30
-
31
-
32
-
33
-
34
-
35
-
36
-
37
-
38
-
39
-
40
-
41
-
42
-
43
-
44
-
45
-
46
-
47
-
48
-
49
-
50
-
51
-
52
-
 53
53 -
 54
54 -
 55
55 -
 56
56 -
 57
57 -
 58
58 -
 59
59 -
 60
60 -
 61
61 -
 62
62 -
 63
63 -
 64
64 -
 65
65 -
 66
66 -
 67
67 -
 68
68 -
 69
69 -
 70
70 -
 71
71 -
 72
72 -
 73
73 -
74
-
75
-
76
-
77
-
78
-
79
-
80
-
81
-
82
-
83
-
84
-
85
-
86
-
87
-
88
-
89
-
90
-
91
-
92
-
93
-
94
-
95
-
96
-
97
-
98
-
99
-
100
-
101
-
102
-
103
-
104
-
105
-
106
-
107
-
108
-
109
-
110
-
111
-
112
-
113
-
114
-
115
-
116
-
117
-
118
-
119
-
120
-
121
-
122
-
123
-
124
-
125
-
126
-
127
-
128
-
129
-
130
-
131
-
132
-
133
-
134
-
135
-
136
-
137
-
138
-
139
-
140
-
141
-
142
-
143
-
144
-
145
-
146
-
147
-
148
-
149
-
150
-
151
-
152
-
153
-
154
-
155
 |
 |

HEWLETT-PACKARD COMPANY AND SUBSIDIARIES
Management’s Discussion and Analysis of
Financial Condition and Results of Operations (Continued)
FINANCIAL CONDITION (Sources and Uses of Cash)
Our total cash and cash equivalents increased approximately 10% to $13.9 billion at October 31,
2005 from $12.7 billion at the end of fiscal 2004. Net earnings in fiscal 2005 helped generate
$8.0 billion in cash from operating activities. The cash generated by operations in fiscal 2005 funded all
of the $6.8 billion in investing and financing activities. Year-over-year borrowings declined 27% to
$5.2 billion at October 31, 2005. The net $6.8 billion used for investing and financing activities during
fiscal 2005 included $3.5 billion for share repurchases, $2.0 billion for gross investments in property
plant and equipment and $1.8 billion for payments of debt. Cash flows from financing activities
benefited from $1.2 billion of proceeds relating to employee stock plans. Our cash position remains
strong and our cash balances are sufficient to cover significant cash outlays expected in fiscal 2006
associated with our restructuring actions and company bonus payments.
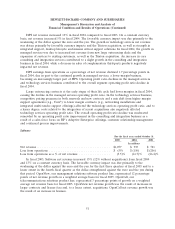
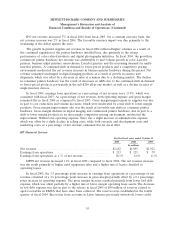
For the fiscal years ended October 31
2005 2004 2003
In millions
Net cash provided by operating activities .................... $8,028 $ 5,088 $ 6,057
Net cash used in investing activities ........................ (1,757) (2,454) (1,512)
Net cash used in financing activities ........................ (5,023) (4,159) (1,549)
Net increase (decrease) in cash and cash equivalents ............ $1,248 $(1,525) $ 2,996
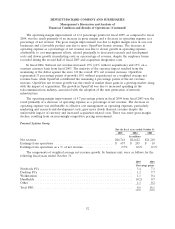
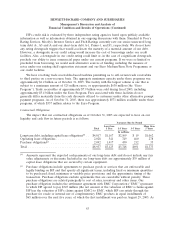
Key Performance Metrics
October 31
2005 2004 2003
Days of sales outstanding in accounts receivable ........................... 39 43 40
Days of supply in inventory .......................................... 35 39 37
Days of purchases outstanding in accounts payable ......................... (52) (51) (56)
Cash conversion cycle .............................................. 22 31 21
Days of sales outstanding in accounts receivable (‘‘DSO’’) measures the average number of days
our receivables are outstanding. DSO is calculated by dividing accounts receivable, net of allowance for
doubtful accounts, by a 90-day average net revenue.
Days of supply in inventory (‘‘DOS’’) measures the average number of days from procurement to
sale of our product. DOS is calculated by dividing inventory by a 90-day average cost of goods sold.
Days of purchases outstanding in accounts payable (‘‘DPO’’) measures the average number of days
our accounts payable balances are outstanding. DPO is calculated by dividing accounts payable by a
90-day average cost of goods sold.
Our working capital requirements depend upon our effective management of the cash conversion
cycle, which represents effectively the number of days that elapse from the day we pay for the purchase
of raw materials to the collection of cash from our customers. The cash conversion cycle is the sum of
DSO and DOS less DPO.
59