HP 2005 Annual Report Download - page 52
Download and view the complete annual report
Please find page 52 of the 2005 HP annual report below. You can navigate through the pages in the report by either clicking on the pages listed below, or by using the keyword search tool below to find specific information within the annual report.-
 1
1 -
2
-
3
-
4
-
5
-
6
-
7
-
8
-
9
-
10
-
11
-
12
-
13
-
14
-
15
-
16
-
17
-
18
-
19
-
20
-
21
-
22
-
23
-
24
-
25
-
26
-
27
-
28
-
29
-
30
-
31
-
32
-
33
-
34
-
35
-
36
-
37
-
38
-
39
-
40
-
41
-
 42
42 -
 43
43 -
 44
44 -
 45
45 -
 46
46 -
 47
47 -
 48
48 -
 49
49 -
 50
50 -
 51
51 -
 52
52 -
 53
53 -
 54
54 -
 55
55 -
 56
56 -
 57
57 -
 58
58 -
 59
59 -
 60
60 -
 61
61 -
 62
62 -
63
-
64
-
65
-
66
-
67
-
68
-
69
-
70
-
71
-
72
-
73
-
74
-
75
-
76
-
77
-
78
-
79
-
80
-
81
-
82
-
83
-
84
-
85
-
86
-
87
-
88
-
89
-
90
-
91
-
92
-
93
-
94
-
95
-
96
-
97
-
98
-
99
-
100
-
101
-
102
-
103
-
104
-
105
-
106
-
107
-
108
-
109
-
110
-
111
-
112
-
113
-
114
-
115
-
116
-
117
-
118
-
119
-
120
-
121
-
122
-
123
-
124
-
125
-
126
-
127
-
128
-
129
-
130
-
131
-
132
-
133
-
134
-
135
-
136
-
137
-
138
-
139
-
140
-
141
-
142
-
143
-
144
-
145
-
146
-
147
-
148
-
149
-
150
-
151
-
152
-
153
-
154
-
155
 |
 |

HEWLETT-PACKARD COMPANY AND SUBSIDIARIES
Management’s Discussion and Analysis of
Financial Condition and Results of Operations (Continued)
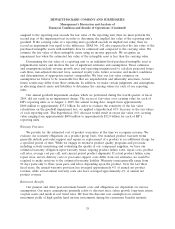
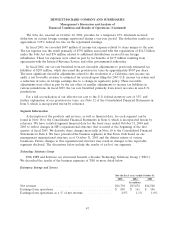
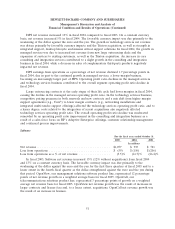
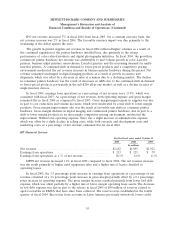
The components of weighted average net revenue growth, by business unit were as follows for the
following fiscal years ended October 31:
2005 2004
Percentage points
Industry standard servers .......................................... 9.3 5.9
Storage ....................................................... 1.2 (1.7)
Business critical systems .......................................... 0.3 (0.5)
Total ESS ..................................................... 10.8 3.7
ESS net revenue increased 11% in fiscal 2005 from fiscal 2004. On a constant currency basis, ESS
net revenue increased 9% in fiscal 2005 from fiscal 2004. The favorable currency impact was due
primarily to the weakening of the dollar against the euro and the yen for the first three quarters of
fiscal 2005 and to a lesser extent in the fourth fiscal quarter as the dollar strengthened against the euro
and the yen during that period.
For fiscal 2005, ESS net revenue growth was due primarily to volume increases and improved
average selling prices (‘‘ASPs’’) in industry standard servers, as a result of both unit growth and
increased option attach rates in the ProLiant server line. The fiscal 2005 net revenue growth rate in
industry standard servers benefited from the internal execution problems described below that
unfavorably impacted the business in the second half of the prior year.
Storage net revenue increased 5% in fiscal 2005 compared to fiscal 2004 due to new product
introductions that contributed to the strong performance of mid-range EVA products and improved
storage sales specialist coverage. For fiscal 2005, storage area networks (‘‘SANs’’) net revenue improved
while revenue growth in the tape and supplies businesses remained flat. Fiscal 2005 storage net revenue
growth rates, in comparison with growth rates in the prior year, benefited from the business challenges
that unfavorably impacted the storage business in the second half of the prior year.
Business critical systems net revenue increased 1% for fiscal 2005 compared to fiscal 2004.
Integrity server net revenue growth for the period was offset partially by revenue decline in the RISC
product line and the planned revenue decline in the Alpha Server product line. The Integrity server
product line posted net revenue growth for the year, representing 20% of the total business critical
systems revenue mix, up from 11% in the prior year. For fiscal 2005, HP-UX server net revenue
increased 5% from the prior year, and NonStop server net revenue declined due to a mature installed
base.
For fiscal 2005, ESS earnings from operations as a percentage of net revenue increased by
3.8 percentage points compared to fiscal 2004, due primarily to a 3.5 percentage point decrease in
operating expenses as a percentage of net revenue, combined with a 0.3 percentage point increase in
gross margin. We recorded $57 million of workforce reduction costs in the first two quarters of fiscal
2005. Our reduced operating expenses reflect the benefits of these measures as well as management
controls on expense spending, which offset the impact of the higher employee bonus accruals recorded
in the second half of the year. The improvement in margin was due primarily to higher option attach
rates and improved discount management, which were offset partially by the continued mix shift
towards industry standard servers within the segment as well as the ongoing mix shift to lower margin
products within the business critical systems business as Integrity products assumed a greater
percentage of business critical systems net revenue. In addition, the year-over-year industry standard
48