HP 2005 Annual Report Download - page 136
Download and view the complete annual report
Please find page 136 of the 2005 HP annual report below. You can navigate through the pages in the report by either clicking on the pages listed below, or by using the keyword search tool below to find specific information within the annual report.-
 1
1 -
2
-
3
-
4
-
5
-
6
-
7
-
8
-
9
-
10
-
11
-
12
-
13
-
14
-
15
-
16
-
17
-
18
-
19
-
20
-
21
-
22
-
23
-
24
-
25
-
26
-
27
-
28
-
29
-
30
-
31
-
32
-
33
-
34
-
35
-
36
-
37
-
38
-
39
-
40
-
41
-
42
-
43
-
44
-
45
-
46
-
47
-
48
-
49
-
50
-
51
-
52
-
53
-
54
-
55
-
56
-
57
-
58
-
59
-
60
-
61
-
62
-
63
-
64
-
65
-
66
-
67
-
68
-
69
-
70
-
71
-
72
-
73
-
74
-
75
-
76
-
77
-
78
-
79
-
80
-
81
-
82
-
83
-
84
-
85
-
86
-
87
-
88
-
89
-
90
-
91
-
92
-
93
-
94
-
95
-
96
-
97
-
98
-
99
-
100
-
101
-
102
-
103
-
104
-
105
-
106
-
107
-
108
-
109
-
110
-
111
-
112
-
113
-
114
-
115
-
116
-
117
-
118
-
119
-
120
-
121
-
122
-
123
-
124
-
125
-
 126
126 -
 127
127 -
 128
128 -
 129
129 -
 130
130 -
 131
131 -
 132
132 -
 133
133 -
 134
134 -
 135
135 -
 136
136 -
 137
137 -
 138
138 -
 139
139 -
 140
140 -
 141
141 -
 142
142 -
 143
143 -
 144
144 -
 145
145 -
 146
146 -
147
-
148
-
149
-
150
-
151
-
152
-
153
-
154
-
155
 |
 |

HEWLETT-PACKARD COMPANY AND SUBSIDIARIES
Notes to Consolidated Financial Statements (Continued)
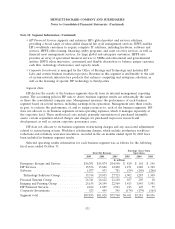
Note 18: Segment Information (Continued)
The reconciliation of segment operating results information to HP consolidated totals was as
follows for the following fiscal years ended October 31:
2005 2004 2003
In millions
Net revenue:
Segment total ........................................... $87,835 $81,020 $73,768
Elimination of intersegment net revenue and other ................ (1,139) (1,115) (707)
Total HP consolidated net revenue ............................ $86,696 $79,905 $73,061
Earnings before taxes:
Total segment earnings from operations ......................... $ 6,011 $ 5,281 $ 4,836
Corporate and unallocated costs and eliminations ................. (429) (246) (296)
Pension curtailment gain .................................... 199 — —
Restructuring charges ...................................... (1,684) (114) (800)
In-process research and development charges ..................... (2) (37) (1)
Acquisition-related charges .................................. — (54) (280)
Amortization of purchased intangible assets ...................... (622) (603) (563)
Interest and other, net ..................................... 189 35 21
(Losses) gains on investments ................................ (13) 4 (29)
Dispute settlement ........................................ (106) (70) —
Total HP consolidated earnings before taxes ..................... $ 3,543 $ 4,196 $ 2,888
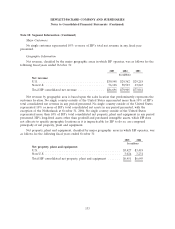
HP allocates its assets to its business segments based on the primary segments benefiting from the
assets. Corporate and unallocated assets are composed primarily of cash and cash equivalents. As
described above, fiscal 2005 segment asset information is stated based on the fiscal 2005 organizational
structure. However, it is not practicable for HP to reclassify fiscal 2003 segment assets for these
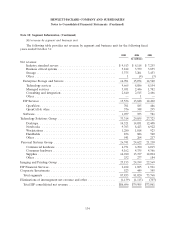
changes. Total assets by segment as well as for TSG and the reconciliation of segment assets to HP
consolidated total assets was as follows at October 31:
2005 2004 2003
In millions
Enterprise Storage and Servers ............................... $13,591 $13,856 $ —
Software ............................................... 1,408 1,422 —
Enterprise Systems Group ................................. 14,999 15,278 15,038
HP Services ............................................. 15,381 14,619 12,700
Technology Solutions Group ............................... $30,380 $29,897 $27,738
Personal Systems Group .................................... 11,277 10,622 10,421
Imaging and Printing Group ................................. 13,523 14,169 13,824
HP Financial Services ...................................... 7,856 7,992 7,830
Corporate Investments ..................................... 297 375 228
Corporate and unallocated assets ............................. 13,984 13,083 14,675
Total HP consolidated assets ................................. $77,317 $76,138 $74,716
132