HP 2005 Annual Report Download - page 42
Download and view the complete annual report
Please find page 42 of the 2005 HP annual report below. You can navigate through the pages in the report by either clicking on the pages listed below, or by using the keyword search tool below to find specific information within the annual report.-
 1
1 -
2
-
3
-
4
-
5
-
6
-
7
-
8
-
9
-
10
-
11
-
12
-
13
-
14
-
15
-
16
-
17
-
18
-
19
-
20
-
21
-
22
-
23
-
24
-
25
-
26
-
27
-
28
-
29
-
30
-
31
-
 32
32 -
 33
33 -
 34
34 -
 35
35 -
 36
36 -
 37
37 -
 38
38 -
 39
39 -
 40
40 -
 41
41 -
 42
42 -
 43
43 -
 44
44 -
 45
45 -
 46
46 -
 47
47 -
 48
48 -
 49
49 -
 50
50 -
 51
51 -
 52
52 -
53
-
54
-
55
-
56
-
57
-
58
-
59
-
60
-
61
-
62
-
63
-
64
-
65
-
66
-
67
-
68
-
69
-
70
-
71
-
72
-
73
-
74
-
75
-
76
-
77
-
78
-
79
-
80
-
81
-
82
-
83
-
84
-
85
-
86
-
87
-
88
-
89
-
90
-
91
-
92
-
93
-
94
-
95
-
96
-
97
-
98
-
99
-
100
-
101
-
102
-
103
-
104
-
105
-
106
-
107
-
108
-
109
-
110
-
111
-
112
-
113
-
114
-
115
-
116
-
117
-
118
-
119
-
120
-
121
-
122
-
123
-
124
-
125
-
126
-
127
-
128
-
129
-
130
-
131
-
132
-
133
-
134
-
135
-
136
-
137
-
138
-
139
-
140
-
141
-
142
-
143
-
144
-
145
-
146
-
147
-
148
-
149
-
150
-
151
-
152
-
153
-
154
-
155
 |
 |
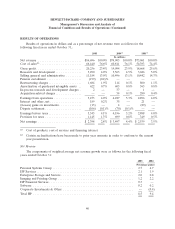
HEWLETT-PACKARD COMPANY AND SUBSIDIARIES
Management’s Discussion and Analysis of
Financial Condition and Results of Operations (Continued)
assigned to the reporting unit exceeds the fair value of the reporting unit, then we must perform the
second step of the impairment test in order to determine the implied fair value of the reporting unit’s
goodwill. If the carrying value of a reporting unit’s goodwill exceeds its implied fair value, then we
record an impairment loss equal to the difference. SFAS No. 142 also requires that the fair value of the
purchased intangible assets with indefinite lives be estimated and compared to the carrying value. We
estimate the fair value of these intangible assets using an income approach. We recognize an
impairment loss when the estimated fair value of the intangible asset is less than the carrying value.
Determining the fair value of a reporting unit or an indefinite-lived purchased intangible asset is
judgmental in nature and involves the use of significant estimates and assumptions. These estimates
and assumptions include revenue growth rates and operating margins used to calculate projected future
cash flows, risk-adjusted discount rates, assumed royalty rates, future economic and market conditions
and determination of appropriate market comparables. We base our fair value estimates on
assumptions we believe to be reasonable but that are unpredictable and inherently uncertain. Actual
future results may differ from those estimates. In addition, we make certain judgments and assumptions
in allocating shared assets and liabilities to determine the carrying values for each of our reporting
units.
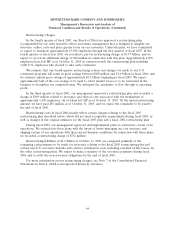
Our annual goodwill impairment analysis, which we performed during the fourth quarter of fiscal
2005, did not result in an impairment charge. The excess of fair value over carrying value for each of
HP’s reporting units as of August 1, 2005, the annual testing date, ranged from approximately
$600 million to approximately $37.1 billion. In order to evaluate the sensitivity of the fair value
calculations on the goodwill impairment test, we applied a hypothetical 10% decrease to the fair values
of each reporting unit. This hypothetical 10% decrease would result in excess fair value over carrying
value ranging from approximately $400 million to approximately $32.8 billion for each of HP’s
reporting units.
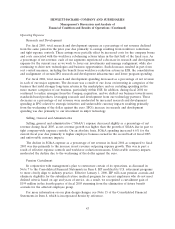
Warranty Provision
We provide for the estimated cost of product warranties at the time we recognize revenue. We
evaluate our warranty obligations on a product group basis. Our standard product warranty terms
generally include post-sales support and repairs or replacement of a product at no additional charge for
a specified period of time. While we engage in extensive product quality programs and processes,
including actively monitoring and evaluating the quality of our component suppliers, we base our
estimated warranty obligation upon warranty terms, ongoing product failure rates, repair costs, product
call rates, average cost per call, and current period product shipments. If actual product failure rates,
repair rates, service delivery costs or post-sales support costs differ from our estimates, we would be
required to make revisions to the estimated warranty liability. Warranty terms generally range from
90 days parts-only to three years parts and labor, depending upon the product. Over the last three
fiscal years, the annual warranty provision has averaged approximately 4% of annual net product
revenue, while actual annual warranty costs also have averaged approximately 4% of annual net
product revenue.
Retirement Benefits
Our pension and other post-retirement benefit costs and obligations are dependent on various
assumptions. Our major assumptions primarily relate to discount rates, salary growth, long-term return
on plan assets and medical cost trend rates. We base the discount rate assumption on current
investment yields of high quality fixed income investments during the retirement benefits maturity
38