HP 2005 Annual Report Download - page 59
Download and view the complete annual report
Please find page 59 of the 2005 HP annual report below. You can navigate through the pages in the report by either clicking on the pages listed below, or by using the keyword search tool below to find specific information within the annual report.-
 1
1 -
2
-
3
-
4
-
5
-
6
-
7
-
8
-
9
-
10
-
11
-
12
-
13
-
14
-
15
-
16
-
17
-
18
-
19
-
20
-
21
-
22
-
23
-
24
-
25
-
26
-
27
-
28
-
29
-
30
-
31
-
32
-
33
-
34
-
35
-
36
-
37
-
38
-
39
-
40
-
41
-
42
-
43
-
44
-
45
-
46
-
47
-
48
-
 49
49 -
 50
50 -
 51
51 -
 52
52 -
 53
53 -
 54
54 -
 55
55 -
 56
56 -
 57
57 -
 58
58 -
 59
59 -
 60
60 -
 61
61 -
 62
62 -
 63
63 -
 64
64 -
 65
65 -
 66
66 -
 67
67 -
 68
68 -
 69
69 -
70
-
71
-
72
-
73
-
74
-
75
-
76
-
77
-
78
-
79
-
80
-
81
-
82
-
83
-
84
-
85
-
86
-
87
-
88
-
89
-
90
-
91
-
92
-
93
-
94
-
95
-
96
-
97
-
98
-
99
-
100
-
101
-
102
-
103
-
104
-
105
-
106
-
107
-
108
-
109
-
110
-
111
-
112
-
113
-
114
-
115
-
116
-
117
-
118
-
119
-
120
-
121
-
122
-
123
-
124
-
125
-
126
-
127
-
128
-
129
-
130
-
131
-
132
-
133
-
134
-
135
-
136
-
137
-
138
-
139
-
140
-
141
-
142
-
143
-
144
-
145
-
146
-
147
-
148
-
149
-
150
-
151
-
152
-
153
-
154
-
155
 |
 |

HEWLETT-PACKARD COMPANY AND SUBSIDIARIES
Management’s Discussion and Analysis of
Financial Condition and Results of Operations (Continued)
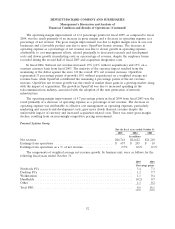
IPG net revenue increased 7% in fiscal 2004 from fiscal 2003. On a constant currency basis, the
net revenue increase was 2% in fiscal 2004. The favorable currency impact was due primarily to the
weakening of the dollar against the euro.
The growth in printer supplies net revenue in fiscal 2004 reflected higher volumes as a result of
the continued expansion of the printer hardware installed base, due primarily to the strong
performance of color-related products and digital photography initiatives. In fiscal 2004, the growth in
commercial printer hardware net revenue was attributable to unit volume growth in color LaserJet
printers, business inkjet printers, monochrome LaserJet printers and the increasing demand for multi-
function printers. A continued shift in demand to lower-priced products and a competitive pricing
environment moderated the net revenue increase in business printer hardware during the period. Net
revenue remained unchanged in digital imaging products as a result of growth in camera unit
shipments, which was offset by a decrease in sales of scanners due to a declining market. The decline
in consumer printer hardware was the result of decreases in ASPs due to the continued shift in demand
to lower-priced products, particularly in the sub-$200 all-in-one market, as well as a decline in sales of
single-function devices.
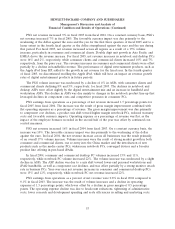
In fiscal 2004, earnings from operations as a percentage of net revenue were 15.9%, which was
consistent with fiscal 2003. As a percentage of net revenue, both operating expense and gross margin
remained flat in fiscal 2004 as compared to fiscal 2003. Gross margin improvement in supplies was due
in part to cost reductions and volume increases, which were moderated by a mix shift to lower margin
products. Gross margin improvement also was the result of favorable mix shifts in consumer printer
hardware. Gross margin declines in digital imaging and commercial printer hardware, due in part to a
shift to lower margin products in an increasingly competitive pricing environment, moderated the
improvement. Within total operating expense, there was a slight increase in administrative expense,
which was offset by a slight decline in selling costs, while both research and development costs and
marketing costs, as a percentage of net revenue, remained flat for fiscal 2004.
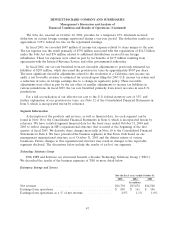
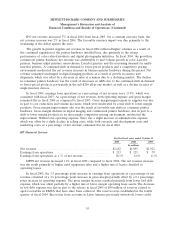
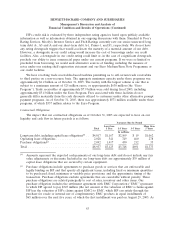
HP Financial Services
For the fiscal years ended October 31
2005 2004 2003
In millions
Net revenue ......................................... $2,102 $1,895 $1,921
Earnings from operations ............................... $ 213 $ 125 $ 79
Earnings from operations as a % of net revenue ............... 10.1% 6.6% 4.1%
HPFS net revenue increased 11% in fiscal 2005 compared to fiscal 2004. The net revenue increase
was the result primarily of higher used equipment sales and a higher mix of leases classified as
operating leases.
In fiscal 2005, the 3.5 percentage point increase in earnings from operations as a percentage of net
revenue consisted of a 3.6 percentage point increase in gross margin partially offset by a 0.1 percentage
point increase in operating expense. The gross margin increase resulted primarily from lower bad debt
expense, which was offset partially by a higher mix of lower margin operating lease assets. The decrease
in bad debt expense was due in part to the release in fiscal 2005 of $40 million of reserves related to
aged receivables in EMEA that have since been collected. The reserves were established in the fourth
quarter of fiscal 2004. Recoveries from accounts in Latin America previously written-off, lower credit
55