HP 2005 Annual Report Download - page 56
Download and view the complete annual report
Please find page 56 of the 2005 HP annual report below. You can navigate through the pages in the report by either clicking on the pages listed below, or by using the keyword search tool below to find specific information within the annual report.-
 1
1 -
2
-
3
-
4
-
5
-
6
-
7
-
8
-
9
-
10
-
11
-
12
-
13
-
14
-
15
-
16
-
17
-
18
-
19
-
20
-
21
-
22
-
23
-
24
-
25
-
26
-
27
-
28
-
29
-
30
-
31
-
32
-
33
-
34
-
35
-
36
-
37
-
38
-
39
-
40
-
41
-
42
-
43
-
44
-
45
-
 46
46 -
 47
47 -
 48
48 -
 49
49 -
 50
50 -
 51
51 -
 52
52 -
 53
53 -
 54
54 -
 55
55 -
 56
56 -
 57
57 -
 58
58 -
 59
59 -
 60
60 -
 61
61 -
 62
62 -
 63
63 -
 64
64 -
 65
65 -
 66
66 -
67
-
68
-
69
-
70
-
71
-
72
-
73
-
74
-
75
-
76
-
77
-
78
-
79
-
80
-
81
-
82
-
83
-
84
-
85
-
86
-
87
-
88
-
89
-
90
-
91
-
92
-
93
-
94
-
95
-
96
-
97
-
98
-
99
-
100
-
101
-
102
-
103
-
104
-
105
-
106
-
107
-
108
-
109
-
110
-
111
-
112
-
113
-
114
-
115
-
116
-
117
-
118
-
119
-
120
-
121
-
122
-
123
-
124
-
125
-
126
-
127
-
128
-
129
-
130
-
131
-
132
-
133
-
134
-
135
-
136
-
137
-
138
-
139
-
140
-
141
-
142
-
143
-
144
-
145
-
146
-
147
-
148
-
149
-
150
-
151
-
152
-
153
-
154
-
155
 |
 |

HEWLETT-PACKARD COMPANY AND SUBSIDIARIES
Management’s Discussion and Analysis of
Financial Condition and Results of Operations (Continued)
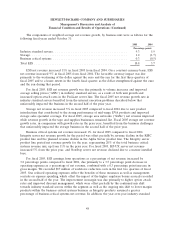
The operating margin improvement of 11.2 percentage points for fiscal 2005, as compared to fiscal
2004, was the result primarily of an increase in gross margin and a decrease in operating expense as a
percentage of net revenue. The gross margin improvement was due to higher margin rates in our core
businesses and a favorable product mix due to more OpenView license revenue. The decrease in
operating expense as a percentage of net revenue was due to slower growth in operating expense
attributable to cost management efforts, related principally to decreased research and development
costs and slower growth in marketing costs as a percentage of revenue, despite the employee bonus
recorded during the second half of fiscal 2005 and acquisition integration costs.
In fiscal 2004, Software net revenue increased 19% (16% without acquisitions) and 13% on a
constant currency basis from fiscal 2003. The majority of the currency impact resulted from the
weakening of the dollar against the euro. Of the overall 19% net revenue increase, OpenView
represented 13 percentage points of growth (10% without acquisitions) on a weighted average net
revenue basis, while OpenCall contributed the remaining 6 percentage points of the net revenue
increase. OpenView net revenue growth was the result of market share gains in a growing market along
with the impact of acquisitions. The growth in OpenCall was due to increased spending in the
telecommunications industry, associated with the adoption of the next generation of network
infrastructure.
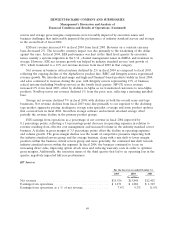
The operating margin improvement of 9.7 percentage points in fiscal 2004 from fiscal 2003 was the
result primarily of a decrease of operating expense as a percentage of net revenue. The decrease in
operating expense was attributable to effective cost management as operating expenses, particularly
marketing and research and development costs, grew more slowly than net revenue despite the
unfavorable impact of currency and increased acquisition-related costs. There was some gross margin
decline, resulting from an increasingly competitive pricing environment.
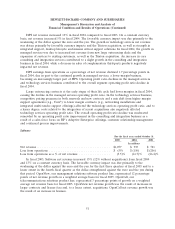
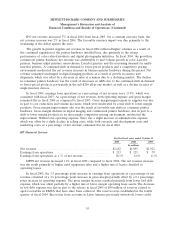
Personal Systems Group
For the fiscal years ended October 31
2005 2004 2003
In millions
Net revenue ........................................... $26,741 $24,622 $21,210
Earnings from operations ................................. $ 657 $ 205 $ 18
Earnings from operations as a % of net revenue ................ 2.5% 0.8% 0.1%
The components of weighted average net revenue growth, by business unit, were as follows for the
following fiscal years ended October 31:
2005 2004
Percentage points
Notebook PCs ..................................................... 5.4 7.1
Desktop PCs ...................................................... 1.2 7.7
Workstations ...................................................... 1.1 0.4
Handhelds ....................................................... (0.2) 0.7
Other ........................................................... 1.1 0.2
Total PSG ........................................................ 8.6 16.1
52