HP 2005 Annual Report Download - page 46
Download and view the complete annual report
Please find page 46 of the 2005 HP annual report below. You can navigate through the pages in the report by either clicking on the pages listed below, or by using the keyword search tool below to find specific information within the annual report.
HEWLETT-PACKARD COMPANY AND SUBSIDIARIES
Management’s Discussion and Analysis of
Financial Condition and Results of Operations (Continued)
Gross Margin
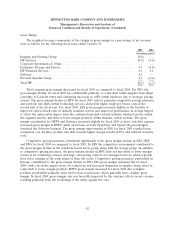
The weighted average components of the change in gross margin as a percentage of net revenue
were as follows for the following fiscal years ended October 31:
2005 2004
Percentage points
Imaging and Printing Group ........................................... (0.8) —
HP Services ....................................................... (0.5) (0.6)
Corporate Investments & Other ........................................ — —
Enterprise Storage and Servers ......................................... 0.1 (0.8)
HP Financial Services ................................................ 0.1 0.1
Software ......................................................... 0.1 —
Personal Systems Group .............................................. 0.5 (0.4)
Total HP ......................................................... (0.5) (1.7)
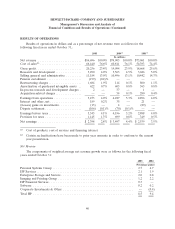
Total company gross margin decreased for fiscal 2005 as compared to fiscal 2004. For IPG, the
gross margin decline for fiscal 2005 was attributable primarily to a mix shift within supplies from inkjet
cartridges to LaserJet toner and continuing decreases in ASPs within hardware due to strategic pricing
actions. The gross margin decline in HPS for fiscal 2005 reflects primarily competitive pricing pressures
and portfolio mix shifts within technology services along with higher employee bonus costs in the
second half of the fiscal year. For fiscal 2005, ESS gross margin increased slightly as the benefits of
improved option attach rates in industry standard servers and improved performance in storage helped
to offset the unfavorable impact from the continued mix shift towards industry standard servers within
the segment and the mix shift to lower margin products within business critical systems. The gross
margin contribution for HPFS and Software increased slightly for fiscal 2005 as lower bad debt expense
increased gross margin in HPFS, while an increase in both OpenView and OpenCall gross margins
benefited the Software business. The gross margin improvement in PSG for fiscal 2005 resulted from
component cost declines, product mix shift towards higher margin notebook PCs and reduced warranty
costs.
Competitive pricing pressures contributed significantly to the gross margin decline in ESS, HPS
and PSG for fiscal 2004 as compared to fiscal 2003. In ESS the competitive environment contributed to
the gross margin decline in the standards based server group along with the storage group. In addition
to competitive pricing pressures, the gross margin decline in HPS reflected mix shifts to lower margin
contracts for technology services and large outsourcing contracts for managed services, which typically
have lower margins in the early stages of their life cycles. Competitive pricing pressures, particularly in
Europe, contributed to the gross margin decline in PSG. IPG gross margin remained flat for fiscal
2004, with a favorable impact from cost reductions and increased shipments in supplies being offset by
a mix shift to lower margin products. HPFS gross margin increased for fiscal 2004 due to higher
portfolio profitability primarily from end-of-lease transactions, which generally have a higher gross
margin. In fiscal 2004, gross margin also was favorably impacted by the currency effects on net revenue
resulting primarily from the weakening of the dollar against the euro.
42


