HP 2005 Annual Report Download - page 38
Download and view the complete annual report
Please find page 38 of the 2005 HP annual report below. You can navigate through the pages in the report by either clicking on the pages listed below, or by using the keyword search tool below to find specific information within the annual report.-
 1
1 -
2
-
3
-
4
-
5
-
6
-
7
-
8
-
9
-
10
-
11
-
12
-
13
-
14
-
15
-
16
-
17
-
18
-
19
-
20
-
21
-
22
-
23
-
24
-
25
-
26
-
27
-
 28
28 -
 29
29 -
 30
30 -
 31
31 -
 32
32 -
 33
33 -
 34
34 -
 35
35 -
 36
36 -
 37
37 -
 38
38 -
 39
39 -
 40
40 -
 41
41 -
 42
42 -
 43
43 -
 44
44 -
 45
45 -
 46
46 -
 47
47 -
 48
48 -
49
-
50
-
51
-
52
-
53
-
54
-
55
-
56
-
57
-
58
-
59
-
60
-
61
-
62
-
63
-
64
-
65
-
66
-
67
-
68
-
69
-
70
-
71
-
72
-
73
-
74
-
75
-
76
-
77
-
78
-
79
-
80
-
81
-
82
-
83
-
84
-
85
-
86
-
87
-
88
-
89
-
90
-
91
-
92
-
93
-
94
-
95
-
96
-
97
-
98
-
99
-
100
-
101
-
102
-
103
-
104
-
105
-
106
-
107
-
108
-
109
-
110
-
111
-
112
-
113
-
114
-
115
-
116
-
117
-
118
-
119
-
120
-
121
-
122
-
123
-
124
-
125
-
126
-
127
-
128
-
129
-
130
-
131
-
132
-
133
-
134
-
135
-
136
-
137
-
138
-
139
-
140
-
141
-
142
-
143
-
144
-
145
-
146
-
147
-
148
-
149
-
150
-
151
-
152
-
153
-
154
-
155
 |
 |

HEWLETT-PACKARD COMPANY AND SUBSIDIARIES
Management’s Discussion and Analysis of
Financial Condition and Results of Operations (Continued)
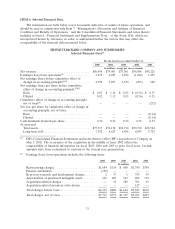
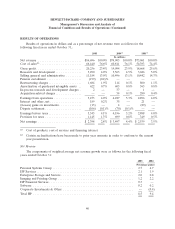
In terms of how our execution has translated into financial performance, our key fiscal 2005
financial metrics were as follows:
TSG
HP
Consolidated ESS HPS Software Total IPG PSG HPFS
in millions, except per share amounts
Net revenue ........... $86,696 $16,701 $15,536 $1,077 $33,314 $25,155 $26,741 $2,102
Year-over-year net revenue
% increase .......... 8% 11% 12% 15% 12% 4% 9% 11%
Earnings (loss) from
operations ........... $3,473 $ 810 $ 1,151 $ (59) $ 1,902 $ 3,413 $ 657 $ 213
Earnings (loss) from
operations as a % of net
revenue ............. 4.0% 4.9% 7.4% (5.5)% 5.7% 13.6% 2.5% 10.1%
Net earnings ........... $2,398
Net earnings per share
Basic .............. $ 0.83
Diluted ............. $ 0.82
Cash and cash equivalents for the fiscal year ended October 31, 2005 totaled $13.9 billion, an
increase of $1.2 billion from the October 31, 2004 balance of $12.7 billion. The increase for fiscal 2005
was due primarily to net cash provided by operating activities and proceeds received from shares issued
in connection with employee stock plans, partially reduced by the repayment of debt and repurchases of
common stock.
We intend the discussion of our financial condition and results of operations that follows to
provide information that will assist in understanding our Consolidated Financial Statements, the
changes in certain key items in those financial statements from year to year, and the primary factors
that accounted for those changes, as well as how certain accounting principles, policies and estimates
affect our Consolidated Financial Statements.
The discussion of results of operations at the consolidated level is followed by a more detailed
discussion of results of operations by segment.
For a further discussion of factors that could impact operating results, see the section entitled
‘‘Risk Factors’’ in Item 1A, which is incorporated herein by reference.
CRITICAL ACCOUNTING POLICIES AND ESTIMATES
General
The Consolidated Financial Statements of HP are prepared in accordance with U.S. generally
accepted accounting principles, which require management to make estimates, judgments and
assumptions that affect the reported amounts of assets, liabilities, net revenue and expenses, and the
disclosure of contingent assets and liabilities. Management bases its estimates on historical experience
and on various other assumptions that it believes to be reasonable under the circumstances, the results
of which form the basis for making judgments about the carrying values of assets and liabilities that are
not readily apparent from other sources. Senior management has discussed the development, selection
and disclosure of these estimates with the Audit Committee of HP’s Board of Directors. Management
believes that the accounting estimates employed and the resulting balances are reasonable; however,
actual results may differ from these estimates under different assumptions or conditions.
34