HP 2005 Annual Report Download - page 54
Download and view the complete annual report
Please find page 54 of the 2005 HP annual report below. You can navigate through the pages in the report by either clicking on the pages listed below, or by using the keyword search tool below to find specific information within the annual report.-
 1
1 -
2
-
3
-
4
-
5
-
6
-
7
-
8
-
9
-
10
-
11
-
12
-
13
-
14
-
15
-
16
-
17
-
18
-
19
-
20
-
21
-
22
-
23
-
24
-
25
-
26
-
27
-
28
-
29
-
30
-
31
-
32
-
33
-
34
-
35
-
36
-
37
-
38
-
39
-
40
-
41
-
42
-
43
-
 44
44 -
 45
45 -
 46
46 -
 47
47 -
 48
48 -
 49
49 -
 50
50 -
 51
51 -
 52
52 -
 53
53 -
 54
54 -
 55
55 -
 56
56 -
 57
57 -
 58
58 -
 59
59 -
 60
60 -
 61
61 -
 62
62 -
 63
63 -
 64
64 -
65
-
66
-
67
-
68
-
69
-
70
-
71
-
72
-
73
-
74
-
75
-
76
-
77
-
78
-
79
-
80
-
81
-
82
-
83
-
84
-
85
-
86
-
87
-
88
-
89
-
90
-
91
-
92
-
93
-
94
-
95
-
96
-
97
-
98
-
99
-
100
-
101
-
102
-
103
-
104
-
105
-
106
-
107
-
108
-
109
-
110
-
111
-
112
-
113
-
114
-
115
-
116
-
117
-
118
-
119
-
120
-
121
-
122
-
123
-
124
-
125
-
126
-
127
-
128
-
129
-
130
-
131
-
132
-
133
-
134
-
135
-
136
-
137
-
138
-
139
-
140
-
141
-
142
-
143
-
144
-
145
-
146
-
147
-
148
-
149
-
150
-
151
-
152
-
153
-
154
-
155
 |
 |

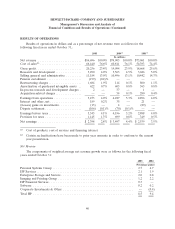
HEWLETT-PACKARD COMPANY AND SUBSIDIARIES
Management’s Discussion and Analysis of
Financial Condition and Results of Operations (Continued)
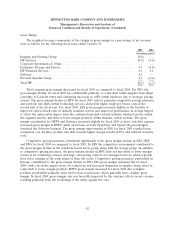
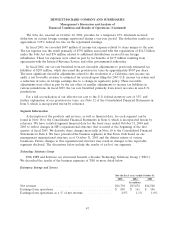
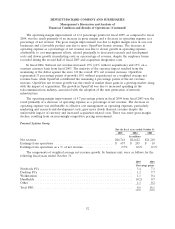
The components of weighted average net revenue growth, by business unit, were as follows for the
following fiscal years ended October 31:
2005 2004
Percentage points
Technology services ................................................. 5.6 5.9
Managed services .................................................. 4.2 5.4
Consulting and integration ............................................ 2.3 0.4
Other ........................................................... 0.1 —
Total HPS ........................................................ 12.2 11.7
HPS net revenue increased 12% in fiscal 2005 from fiscal 2004. On a constant currency basis, HPS
net revenue increased 9% in fiscal 2005 from fiscal 2004. The favorable currency impact was due
primarily to the weakening of the dollar against the euro and the yen for the first three quarters of
fiscal 2005 and to a lesser extent in the fourth fiscal quarter as the dollar strengthened against the euro
and the yen during that period. Excluding acquisitions made since the first quarter of fiscal 2004, HPS
net revenue growth for fiscal 2005 was 8%. Net revenue in technology services increased 9% for fiscal
2005. Excluding acquisitions made since the first quarter of fiscal 2004, technology services net revenue
growth for fiscal 2005 was 4%.
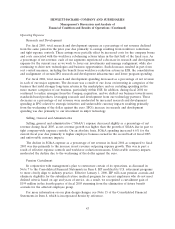
For fiscal 2005, managed services net revenue increased 24% from the prior-year as a result of an
increase in new contracts, as well as additional revenue from our installed base of large customer
contracts, the full year contribution of the Triaton acquisition (which we completed in April 2004) and
favorable currency impacts. Excluding Triaton, managed services net revenue growth was 22% for fiscal
2005 compared to the prior fiscal year.
Net revenue in consulting and integration increased 13% for fiscal 2005 from the prior year due to
strong order growth in EMEA and Asia Pacific, as well as the favorable impact of currency.
Additionally, the Triaton acquisition added to the revenue growth.
HPS earnings from operations as a percentage of net revenue for fiscal 2005 declined
1.9 percentage points. The operating margin decline was the result of the combination of a decline in
gross margin offset partially by a decrease in operating expense as a percentage of net revenue. The
gross margin decline in HPS reflected primarily competitive pricing pressures and portfolio mix shifts
within technology services, as well as the cost of higher employee bonus costs recorded in the second
half of the fiscal year, and the absorption of workforce reduction costs in the first half of the year that
amounted to $89 million. The technology services portfolio continues to evolve from higher margin
proprietary support to lower margin areas such as multi-vendor integrated support and network
environmental services. Managed services gross margin increased due to improvements in delivery cost
management across the installed base. Consulting and integration gross margin improved due to higher
revenues and continued operational improvement in presales and delivery cost management.
For fiscal 2005, reductions and efficiencies in our operating expense structure contributed to the
decline in operating expenses as a percentage of net revenue, despite $11 million in workforce
reduction costs in the first half of the fiscal year and the impact of the employee bonuses granted in
the second half of the fiscal year.
50