HP 2005 Annual Report Download - page 44
Download and view the complete annual report
Please find page 44 of the 2005 HP annual report below. You can navigate through the pages in the report by either clicking on the pages listed below, or by using the keyword search tool below to find specific information within the annual report.-
 1
1 -
2
-
3
-
4
-
5
-
6
-
7
-
8
-
9
-
10
-
11
-
12
-
13
-
14
-
15
-
16
-
17
-
18
-
19
-
20
-
21
-
22
-
23
-
24
-
25
-
26
-
27
-
28
-
29
-
30
-
31
-
32
-
33
-
 34
34 -
 35
35 -
 36
36 -
 37
37 -
 38
38 -
 39
39 -
 40
40 -
 41
41 -
 42
42 -
 43
43 -
 44
44 -
 45
45 -
 46
46 -
 47
47 -
 48
48 -
 49
49 -
 50
50 -
 51
51 -
 52
52 -
 53
53 -
 54
54 -
55
-
56
-
57
-
58
-
59
-
60
-
61
-
62
-
63
-
64
-
65
-
66
-
67
-
68
-
69
-
70
-
71
-
72
-
73
-
74
-
75
-
76
-
77
-
78
-
79
-
80
-
81
-
82
-
83
-
84
-
85
-
86
-
87
-
88
-
89
-
90
-
91
-
92
-
93
-
94
-
95
-
96
-
97
-
98
-
99
-
100
-
101
-
102
-
103
-
104
-
105
-
106
-
107
-
108
-
109
-
110
-
111
-
112
-
113
-
114
-
115
-
116
-
117
-
118
-
119
-
120
-
121
-
122
-
123
-
124
-
125
-
126
-
127
-
128
-
129
-
130
-
131
-
132
-
133
-
134
-
135
-
136
-
137
-
138
-
139
-
140
-
141
-
142
-
143
-
144
-
145
-
146
-
147
-
148
-
149
-
150
-
151
-
152
-
153
-
154
-
155
 |
 |

HEWLETT-PACKARD COMPANY AND SUBSIDIARIES
Management’s Discussion and Analysis of
Financial Condition and Results of Operations (Continued)
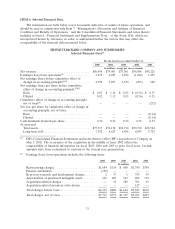
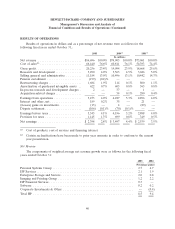
RESULTS OF OPERATIONS
Results of operations in dollars and as a percentage of net revenue were as follows for the
following fiscal years ended October 31,:
2005 2004(2) 2003(2)
In millions
Net revenue ......................... $86,696 100.0% $79,905 100.0% $73,061 100.0%
Cost of sales(1) ........................ 66,440 76.6% 60,811 76.1% 54,393 74.4%
Gross profit .......................... 20,256 23.4% 19,094 23.9% 18,668 25.6%
Research and development ............... 3,490 4.0% 3,563 4.5% 3,686 5.0%
Selling, general and administrative ......... 11,184 13.0% 10,496 13.1% 10,442 14.3%
Pension curtailment .................... (199) (0.2)% — — — —
Restructuring charges ................... 1,684 1.9% 114 0.1% 800 1.1%
Amortization of purchased intangible assets . . 622 0.7% 603 0.8% 563 0.8%
In-process research and development charges . 2 — 37 — 1 —
Acquisition-related charges ............... — — 54 0.1% 280 0.4%
Earnings from operations ................ 3,473 4.0% 4,227 5.3% 2,896 4.0%
Interest and other, net .................. 189 0.2% 35 — 21 —
(Losses) gains on investments ............. (13) — 4 — (29) —
Dispute settlement ..................... (106) (0.1)% (70) (0.1)% — —
Earnings before taxes ................... 3,543 4.1% 4,196 5.2% 2,888 4.0%
Provision for taxes ..................... 1,145 1.3% 699 0.8% 349 0.5%
Net earnings ......................... $ 2,398 2.8% $ 3,497 4.4% $ 2,539 3.5%
(1) Cost of products, cost of services and financing interest.
(2) Certain reclassifications have been made to prior year amounts in order to conform to the current
year presentation.
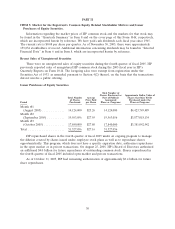
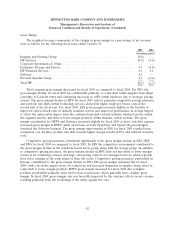
Net Revenue
The components of weighted average net revenue growth were as follows for the following fiscal
years ended October 31:
2005 2004
Percentage points
Personal Systems Group .............................................. 2.7 4.7
HP Services ....................................................... 2.1 1.9
Enterprise Storage and Servers ......................................... 2.0 0.8
Imaging and Printing Group ........................................... 1.2 2.2
HP Financial Services ................................................ 0.3 —
Software ......................................................... 0.2 0.2
Corporate Investments & Other ........................................ — (0.4)
Total HP ......................................................... 8.5 9.4
40