HP 2005 Annual Report Download - page 138
Download and view the complete annual report
Please find page 138 of the 2005 HP annual report below. You can navigate through the pages in the report by either clicking on the pages listed below, or by using the keyword search tool below to find specific information within the annual report.-
 1
1 -
2
-
3
-
4
-
5
-
6
-
7
-
8
-
9
-
10
-
11
-
12
-
13
-
14
-
15
-
16
-
17
-
18
-
19
-
20
-
21
-
22
-
23
-
24
-
25
-
26
-
27
-
28
-
29
-
30
-
31
-
32
-
33
-
34
-
35
-
36
-
37
-
38
-
39
-
40
-
41
-
42
-
43
-
44
-
45
-
46
-
47
-
48
-
49
-
50
-
51
-
52
-
53
-
54
-
55
-
56
-
57
-
58
-
59
-
60
-
61
-
62
-
63
-
64
-
65
-
66
-
67
-
68
-
69
-
70
-
71
-
72
-
73
-
74
-
75
-
76
-
77
-
78
-
79
-
80
-
81
-
82
-
83
-
84
-
85
-
86
-
87
-
88
-
89
-
90
-
91
-
92
-
93
-
94
-
95
-
96
-
97
-
98
-
99
-
100
-
101
-
102
-
103
-
104
-
105
-
106
-
107
-
108
-
109
-
110
-
111
-
112
-
113
-
114
-
115
-
116
-
117
-
118
-
119
-
120
-
121
-
122
-
123
-
124
-
125
-
126
-
127
-
 128
128 -
 129
129 -
 130
130 -
 131
131 -
 132
132 -
 133
133 -
 134
134 -
 135
135 -
 136
136 -
 137
137 -
 138
138 -
 139
139 -
 140
140 -
 141
141 -
 142
142 -
 143
143 -
 144
144 -
 145
145 -
 146
146 -
 147
147 -
 148
148 -
149
-
150
-
151
-
152
-
153
-
154
-
155
 |
 |

HEWLETT-PACKARD COMPANY AND SUBSIDIARIES
Notes to Consolidated Financial Statements (Continued)
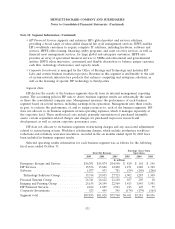
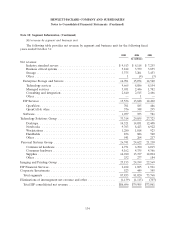
Note 18: Segment Information (Continued)
Net revenue by segment and business unit
The following table provides net revenue by segment and business unit for the following fiscal
years ended October 31:
2005 2004 2003
In millions
Net revenue:
Industry standard servers ................................ $ 9,513 $ 8,118 $ 7,255
Business critical systems ................................. 3,812 3,759 3,835
Storage ............................................. 3,375 3,201 3,453
Other .............................................. 1 (4) (3)
Enterprise Storage and Servers ............................. 16,701 15,074 14,540
Technology services .................................... 9,665 8,886 8,154
Managed services ..................................... 3,031 2,446 1,782
Consulting and integration ............................... 2,840 2,515 2,466
Other .............................................. — 1 —
HP Services ........................................... 15,536 13,848 12,402
OpenView ........................................... 701 585 486
OpenCall & other ..................................... 376 348 295
Software .............................................. 1,077 933 781
Technology Solutions Group ................................. 33,314 29,855 27,723
Desktops ............................................ 14,321 14,031 12,408
Notebooks .......................................... 9,763 8,423 6,922
Workstations ......................................... 1,280 1,018 923
Handhelds .......................................... 836 886 740
Other .............................................. 541 264 217
Personal Systems Group ................................... 26,741 24,622 21,210
Commercial hardware .................................. 6,731 6,390 6,015
Consumer hardware .................................... 4,162 4,335 4,366
Supplies ............................................ 14,010 13,197 12,004
Other .............................................. 252 277 184
Imaging and Printing Group ................................. 25,155 24,199 22,569
HP Financial Services ...................................... 2,102 1,895 1,921
Corporate Investments ..................................... 523 449 345
Total segments ......................................... 87,835 81,020 73,768
Eliminations of intersegment net revenue and other ................ (1,139) (1,115) (707)
Total HP consolidated net revenue ........................... $86,696 $79,905 $73,061
134