HP 2005 Annual Report Download - page 121
Download and view the complete annual report
Please find page 121 of the 2005 HP annual report below. You can navigate through the pages in the report by either clicking on the pages listed below, or by using the keyword search tool below to find specific information within the annual report.-
 1
1 -
2
-
3
-
4
-
5
-
6
-
7
-
8
-
9
-
10
-
11
-
12
-
13
-
14
-
15
-
16
-
17
-
18
-
19
-
20
-
21
-
22
-
23
-
24
-
25
-
26
-
27
-
28
-
29
-
30
-
31
-
32
-
33
-
34
-
35
-
36
-
37
-
38
-
39
-
40
-
41
-
42
-
43
-
44
-
45
-
46
-
47
-
48
-
49
-
50
-
51
-
52
-
53
-
54
-
55
-
56
-
57
-
58
-
59
-
60
-
61
-
62
-
63
-
64
-
65
-
66
-
67
-
68
-
69
-
70
-
71
-
72
-
73
-
74
-
75
-
76
-
77
-
78
-
79
-
80
-
81
-
82
-
83
-
84
-
85
-
86
-
87
-
88
-
89
-
90
-
91
-
92
-
93
-
94
-
95
-
96
-
97
-
98
-
99
-
100
-
101
-
102
-
103
-
104
-
105
-
106
-
107
-
108
-
109
-
110
-
 111
111 -
 112
112 -
 113
113 -
 114
114 -
 115
115 -
 116
116 -
 117
117 -
 118
118 -
 119
119 -
 120
120 -
 121
121 -
 122
122 -
 123
123 -
 124
124 -
 125
125 -
 126
126 -
 127
127 -
 128
128 -
 129
129 -
 130
130 -
 131
131 -
132
-
133
-
134
-
135
-
136
-
137
-
138
-
139
-
140
-
141
-
142
-
143
-
144
-
145
-
146
-
147
-
148
-
149
-
150
-
151
-
152
-
153
-
154
-
155
 |
 |

HEWLETT-PACKARD COMPANY AND SUBSIDIARIES
Notes to Consolidated Financial Statements (Continued)
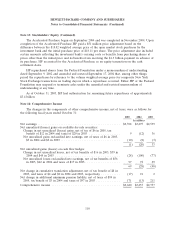
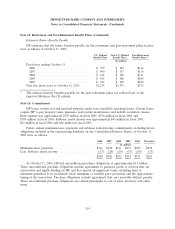
Note 15: Retirement and Post-Retirement Benefit Plans (Continued)
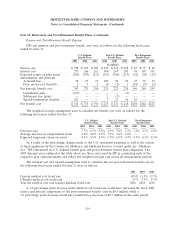
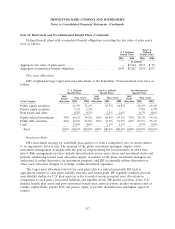
Defined benefit plans with accumulated benefit obligations exceeding the fair value of plan assets
were as follows:
Non-U.S.
U.S. Defined Defined
Benefit Plans Benefit Plans
2005 2004 2005 2004
In millions
Aggregate fair value of plan assets ............................ — $3,244 $311 $ 98
Aggregate accumulated benefit obligation ....................... $159 $3,882 $535 $271
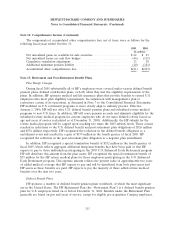
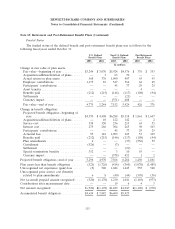
Plan Asset Allocations
HP’s weighted-average target and asset allocations at the September 30 measurement date were as
follows:
U. S. Defined Non-U.S. Defined Post-Retirement
Benefit Plans Benefit Plans Benefit Plans
2005 2005 2005
Plan Assets Plan Assets Plan Assets
Target Target Target
Asset Category Allocation 2005 2004 Allocation 2005 2004 Allocation 2005 2004
Public equity securities .... 61.3% 71.4% 63.5% 64.8% 68.4% 69.4%
Private equity securities .... 2.1% 2.5% — — 7.0% 6.7%
Real estate and other ..... 0.2% 0.3% 2.5% 2.6% 0.7% 0.8%
Equity-related investments . 74% 63.6% 74.2% 64% 66.0% 67.4% 76% 76.1% 76.9%
Public debt securities ...... 26% 22.6% 25.8% 36% 31.9% 31.5% 24% 23.6% 23.1%
Cash ................. 13.8% 0.0% 2.1% 1.1% 0.3% 0.0%
Total ............... 100% 100.0% 100.0% 100% 100.0% 100.0% 100% 100.0% 100.0%
Investment Policy
HP’s investment strategy for worldwide plan assets is to seek a competitive rate of return relative
to an appropriate level of risk. The majority of the plans’ investment managers employ active
investment management strategies with the goal of outperforming the broad markets in which they
invest. Risk management practices include diversification across asset classes and investment styles and
periodic rebalancing toward asset allocation targets. A number of the plans’ investment managers are
authorized to utilize derivatives for investment purposes, and HP occasionally utilizes derivatives to
effect asset allocation changes or to hedge certain investment exposures.
The target asset allocation selected for each plan reflects a risk/return profile HP feels is
appropriate relative to each plan’s liability structure and return goals. HP regularly conducts periodic
asset-liability studies for U.S. plan assets in order to model various potential asset allocations in
comparison to each plan’s forecasted liabilities and liquidity needs. HP invests a portion of the U.S.
defined benefit plan assets and post-retirement benefit plan assets in private market securities such as
venture capital funds, private debt and private equity to provide diversification and higher expected
returns.
117