HP 2005 Annual Report Download - page 120
Download and view the complete annual report
Please find page 120 of the 2005 HP annual report below. You can navigate through the pages in the report by either clicking on the pages listed below, or by using the keyword search tool below to find specific information within the annual report.-
 1
1 -
2
-
3
-
4
-
5
-
6
-
7
-
8
-
9
-
10
-
11
-
12
-
13
-
14
-
15
-
16
-
17
-
18
-
19
-
20
-
21
-
22
-
23
-
24
-
25
-
26
-
27
-
28
-
29
-
30
-
31
-
32
-
33
-
34
-
35
-
36
-
37
-
38
-
39
-
40
-
41
-
42
-
43
-
44
-
45
-
46
-
47
-
48
-
49
-
50
-
51
-
52
-
53
-
54
-
55
-
56
-
57
-
58
-
59
-
60
-
61
-
62
-
63
-
64
-
65
-
66
-
67
-
68
-
69
-
70
-
71
-
72
-
73
-
74
-
75
-
76
-
77
-
78
-
79
-
80
-
81
-
82
-
83
-
84
-
85
-
86
-
87
-
88
-
89
-
90
-
91
-
92
-
93
-
94
-
95
-
96
-
97
-
98
-
99
-
100
-
101
-
102
-
103
-
104
-
105
-
106
-
107
-
108
-
109
-
 110
110 -
 111
111 -
 112
112 -
 113
113 -
 114
114 -
 115
115 -
 116
116 -
 117
117 -
 118
118 -
 119
119 -
 120
120 -
 121
121 -
 122
122 -
 123
123 -
 124
124 -
 125
125 -
 126
126 -
 127
127 -
 128
128 -
 129
129 -
 130
130 -
131
-
132
-
133
-
134
-
135
-
136
-
137
-
138
-
139
-
140
-
141
-
142
-
143
-
144
-
145
-
146
-
147
-
148
-
149
-
150
-
151
-
152
-
153
-
154
-
155
 |
 |

HEWLETT-PACKARD COMPANY AND SUBSIDIARIES
Notes to Consolidated Financial Statements (Continued)
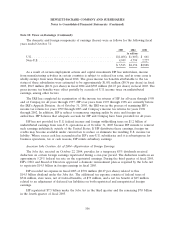
Note 15: Retirement and Post-Retirement Benefit Plans (Continued)
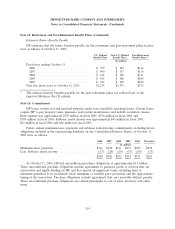
The weighted average assumptions used to calculate the benefit obligation as of the September 30
measurement date were as follows:
U.S. Defined Non-U.S. Defined Post-Retirement
Benefit Plans Benefit Plans Benefit Plans
2005 2004 2005 2004 2005 2004
Discount rate .............................. 5.6% 5.8% 4.2% 4.9% 5.7% 5.8%
Average increase in compensation levels .......... 4.0% 4.0% 3.7% 3.7% — —
Current medical cost trend rate ................ — — — — 9.5% 10.5%
Ultimate medical cost trend rate ................ — — — — 5.5% 5.5%
Year the rate reaches ultimate trend rate .......... — — — — 2010 2010
A 1.0 percentage point increase in the medical cost trend rate would have increased the total
post-retirement benefit obligation reported at October 31, 2005 by $11 million, while a 1.0 percentage
point decrease would have resulted in a decrease of $13 million.
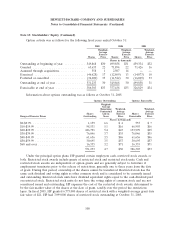
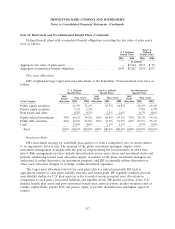
The net amount recognized for HP’s defined benefit and post-retirement benefit plans was as
follows for the following fiscal years ended October 31:
U.S. Defined Non-U.S. Defined Post-Retirement
Benefit Plans Benefit Plans Benefit Plans
2005 2004 2005 2004 2005 2004
In millions
Prepaid benefit costs ..................... $395 $ — $1,494 $1,306 $ — $ —
Other accrued liabilities ................... — (300) — — —
Pension, post-retirement and post-employment
liabilities ............................ (915) (1,152) (284) (269) (1,110) (973)
Accumulated other comprehensive loss ........ — 274 20 4 — —
Contribution after measurement date ......... — — 19 6 4 3
Net amount recognized ................... $(520) $(1,178) $1,249 $1,047 $(1,106) $(970)
Defined benefit plans with projected benefit obligations exceeding the fair value of plan assets
were as follows:
U.S. Defined Non-U.S. Defined
Benefit Plans Benefit Plans
2005 2004 2005 2004
In millions
Aggregate fair value of plan assets ........................ $1,929 $3,244 $5,211 $4,051
Aggregate projected benefit obligation ..................... $2,677 $4,970 $5,824 $4,512
116