HP 2005 Annual Report Download - page 51
Download and view the complete annual report
Please find page 51 of the 2005 HP annual report below. You can navigate through the pages in the report by either clicking on the pages listed below, or by using the keyword search tool below to find specific information within the annual report.-
 1
1 -
2
-
3
-
4
-
5
-
6
-
7
-
8
-
9
-
10
-
11
-
12
-
13
-
14
-
15
-
16
-
17
-
18
-
19
-
20
-
21
-
22
-
23
-
24
-
25
-
26
-
27
-
28
-
29
-
30
-
31
-
32
-
33
-
34
-
35
-
36
-
37
-
38
-
39
-
40
-
 41
41 -
 42
42 -
 43
43 -
 44
44 -
 45
45 -
 46
46 -
 47
47 -
 48
48 -
 49
49 -
 50
50 -
 51
51 -
 52
52 -
 53
53 -
 54
54 -
 55
55 -
 56
56 -
 57
57 -
 58
58 -
 59
59 -
 60
60 -
 61
61 -
62
-
63
-
64
-
65
-
66
-
67
-
68
-
69
-
70
-
71
-
72
-
73
-
74
-
75
-
76
-
77
-
78
-
79
-
80
-
81
-
82
-
83
-
84
-
85
-
86
-
87
-
88
-
89
-
90
-
91
-
92
-
93
-
94
-
95
-
96
-
97
-
98
-
99
-
100
-
101
-
102
-
103
-
104
-
105
-
106
-
107
-
108
-
109
-
110
-
111
-
112
-
113
-
114
-
115
-
116
-
117
-
118
-
119
-
120
-
121
-
122
-
123
-
124
-
125
-
126
-
127
-
128
-
129
-
130
-
131
-
132
-
133
-
134
-
135
-
136
-
137
-
138
-
139
-
140
-
141
-
142
-
143
-
144
-
145
-
146
-
147
-
148
-
149
-
150
-
151
-
152
-
153
-
154
-
155
 |
 |

HEWLETT-PACKARD COMPANY AND SUBSIDIARIES
Management’s Discussion and Analysis of
Financial Condition and Results of Operations (Continued)
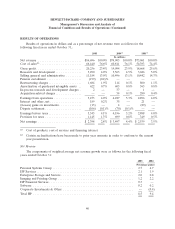
The Jobs Act, enacted on October 22, 2004, provides for a temporary 85% dividends received
deduction on certain foreign earnings repatriated during a one-year period. The deduction results in an
approximate 5.25% federal tax rate on the repatriated earnings.
In fiscal 2005, we recorded $697 million of income tax expense related to items unique to the year.
The tax expense was the result primarily of $792 million associated with the repatriation of $14.5 billion
under the Jobs Act and $76 million related to additional distributions received from foreign
subsidiaries. These tax expenses were offset in part by tax benefits of $177 million resulting from
agreements with the Internal Revenue Service and other governmental authorities.
In fiscal 2004, our tax rate benefited from net favorable adjustments to previously estimated tax
liabilities of $207 million, which decreased the provision for taxes by approximately $0.07 per share.
The most significant favorable adjustments related to the resolution of a California state income tax
audit, a net favorable revision to estimated tax accruals upon filing the 2003 U.S. income tax return and
a reduction in taxes on foreign earnings due to a change in regulatory policy. These favorable
adjustments were offset in part by the net effect of smaller adjustments to income tax liabilities in
various jurisdictions. In fiscal 2003, the tax rate benefited primarily from lower tax rates in non-U.S.
jurisdictions.
For a full reconciliation of our effective tax rate to the U.S. federal statutory rate of 35% and
further explanation of our provision for taxes, see Note 12 of the Consolidated Financial Statements in
Item 8, which is incorporated herein by reference.
Segment Information
A description of the products and services, as well as financial data, for each segment can be
found in Note 18 to the Consolidated Financial Statements in Item 8, which is incorporated herein by
reference. We have restated segment financial data for the fiscal years ended October 31, 2004 and
2003 to reflect changes in HP’s organizational structure that occurred at the beginning of the first
quarter of fiscal 2005. We describe these changes more fully in Note 18 to the Consolidated Financial
Statements in Item 8. We have presented the business segments in this Form 10-K based on our
management organizational structure as of October 31, 2005 and the distinct nature of various
businesses. Future changes to this organizational structure may result in changes to the reportable
segments disclosed. The discussions below include the results of each of our segments.
Technology Solutions Group
ESS, HPS and Software are structured beneath a broader Technology Solutions Group (‘‘TSG’’).
We described the results of the business segments of TSG in more detail below.
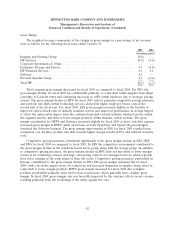
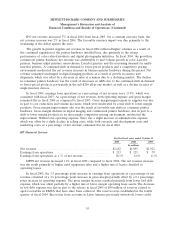
Enterprise Storage and Servers
For the fiscal years ended October 31
2005 2004 2003
In millions
Net revenue ........................................... $16,701 $15,074 $14,540
Earnings from operations ................................. $ 810 $ 161 $ 146
Earnings from operations as a % of net revenue ................ 4.9% 1.1% 1.0%
47