GameStop 2013 Annual Report Download - page 95
Download and view the complete annual report
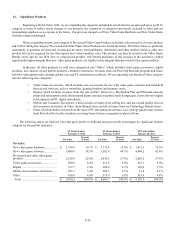
Please find page 95 of the 2013 GameStop annual report below. You can navigate through the pages in the report by either clicking on the pages listed below, or by using the keyword search tool below to find specific information within the annual report.-
 1
1 -
2
-
3
-
4
-
5
-
6
-
7
-
8
-
9
-
10
-
11
-
12
-
13
-
14
-
15
-
16
-
17
-
18
-
19
-
20
-
21
-
22
-
23
-
24
-
25
-
26
-
27
-
28
-
29
-
30
-
31
-
32
-
33
-
34
-
35
-
36
-
37
-
38
-
39
-
40
-
41
-
42
-
43
-
44
-
45
-
46
-
47
-
48
-
49
-
50
-
51
-
52
-
53
-
54
-
55
-
56
-
57
-
58
-
59
-
60
-
61
-
62
-
63
-
64
-
65
-
66
-
67
-
68
-
69
-
70
-
71
-
72
-
73
-
74
-
75
-
76
-
77
-
78
-
79
-
80
-
81
-
82
-
83
-
84
-
 85
85 -
 86
86 -
 87
87 -
 88
88 -
 89
89 -
 90
90 -
 91
91 -
 92
92 -
 93
93 -
 94
94 -
 95
95 -
 96
96 -
 97
97 -
 98
98 -
 99
99 -
 100
100 -
 101
101 -
 102
102 -
 103
103 -
 104
104 -
 105
105 -
106
-
107
-
108
-
109
-
110
-
111
-
112
-
113
 |
 |

F-22
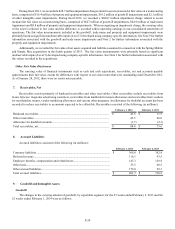
units. Additionally, we identified hypothetical unrecognized fair value changes to merchandise inventories, property and equipment,
unfavorable leasehold interests and deferred income taxes. The combination of these hypothetical unrecognized intangible assets
and other hypothetical unrecognized fair value changes to the carrying values of other assets and liabilities, together with the lower
reporting unit fair values calculated in step one, resulted in an implied fair value of goodwill below the carrying value of goodwill
for the Australia, Canada and Europe reporting units. Accordingly, we recorded non-cash, non-tax deductible goodwill impairments
for the third quarter of fiscal 2012 of $107.1 million, $100.3 million and $419.6 million in our Australia, Canada and Europe
reporting units, respectively, to reduce the carrying value of goodwill.
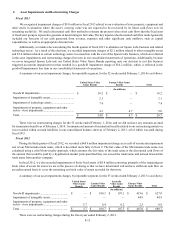
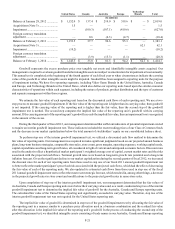
There were no impairments to goodwill prior to the $627 million charge recorded in fiscal 2012, with the exception of a
$3.3 million charge recorded in fiscal 2011 related to the exit of non-core operations. During fiscal 2013, $10.2 million of goodwill
was expensed in the United States segment as a result of the exiting of an immaterial non-core business. Cumulative goodwill
impairment losses were $640.5 million as of February 1, 2014, of which $13.5 million, $100.3 million, $107.1 million and $419.6
million were attributable to our United States, Canada, Australia and Europe reporting units, respectively.
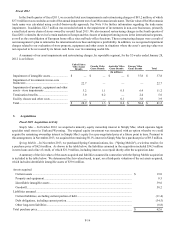
Intangible Assets
Intangible assets, primarily from the EB merger and Micromania acquisition, consist of internally developed software,
amounts attributed to favorable leasehold interests and advertiser relationships which are included in other intangible assets in the
consolidated balance sheet. The trade names acquired, primarily Micromania, have been determined to be indefinite-lived intangible
assets and are therefore not subject to amortization. The total weighted-average amortization period for the remaining intangible
assets, excluding goodwill, is approximately six years. The intangible assets are being amortized based upon the pattern in which
the economic benefits of the intangible assets are being utilized, with no expected residual value.
As a result of the impairment indicators described in the discussion above of the interim goodwill impairment test, during
the third quarter of fiscal 2012, we also tested our long-lived assets for impairment and concluded that our Micromania trade name
was impaired. As a result of the interim impairment test, we recorded a $44.9 million impairment charge of our Micromania trade
name for the third quarter of fiscal 2012. For fiscal 2011, we recorded a $37.8 million charge as a result of our annual impairment
test of our Micromania trade name. There were no trade name impairments recorded as a result of the fiscal 2013 annual impairment
test. For each impairment test, the fair value of our Micromania trade name was calculated using a relief-from-royalty approach,
which assumes the fair value of the trade name is the discounted cash flows of the amount that would be paid by a hypothetical
market participant had they not owned the trade name and instead licensed the trade name from another company. The basis for
future cash flow projections is internal revenue forecasts, which we believe represent reasonable market participant assumptions,
to which the selected royalty rate is applied. These future cash flows are discounted using the applicable discount rate, as well as
any potential risk premium to reflect the inherent risk of holding a standalone intangible asset. The discount rate used in the analysis
reflects a hypothetical market participant’s weighted average cost of capital, current market rates and the risks associated with the
projected cash flows.
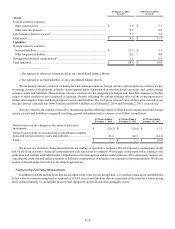
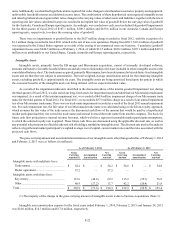
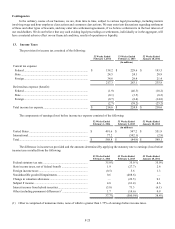
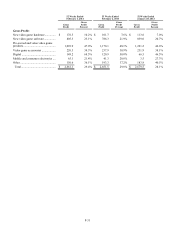
The gross carrying amount and accumulated amortization of our intangible assets other than goodwill as of February 1, 2014
and February 2, 2013 were as follows (in millions):
As of February 1, 2014 As of February 2, 2013
Gross
Carrying
Amount(1)
Accumulated
Amortization
Net
Carrying
Amount
Gross
Carrying
Amount
Accumulated
Amortization
Net
Carrying
Amount
Intangible assets with indefinite lives:
Trade names............................................... $ 54.2 $ — $ 54.2 $ 54.8 $ — $ 54.8
Dealer agreement ....................................... 57.2 — 57.2 — — —
Intangible assets with finite lives:
Key money................................................. 113.6 (44.4) 69.2 115.9 (39.1) 76.8
Other .......................................................... 40.9 (27.2) 13.7 42.2 (20.4) 21.8
Total.............................................................. $ 265.9 $ (71.6) $ 194.3 $ 212.9 $ (59.5) $ 153.4
(1) The majority of the change in the gross carrying amount of intangible assets is due to business acquisitions (Note 3).
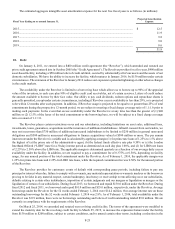
Intangible asset amortization expense for the fiscal years ended February 1, 2014, February 2, 2013 and January 28, 2012
was $14.0 million, $14.3 million and $17.8 million, respectively.