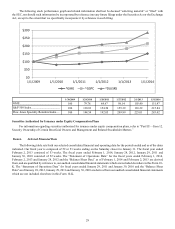
GameStop 2013 Annual Report Download - page 56
Download and view the complete annual report
Please find page 56 of the 2013 GameStop annual report below. You can navigate through the pages in the report by either clicking on the pages listed below, or by using the keyword search tool below to find specific information within the annual report.-
 1
1 -
2
-
3
-
4
-
5
-
6
-
7
-
8
-
9
-
10
-
11
-
12
-
13
-
14
-
15
-
16
-
17
-
18
-
19
-
20
-
21
-
22
-
23
-
24
-
25
-
26
-
27
-
28
-
29
-
30
-
31
-
32
-
33
-
34
-
35
-
36
-
37
-
38
-
39
-
40
-
41
-
42
-
43
-
44
-
45
-
 46
46 -
 47
47 -
 48
48 -
 49
49 -
 50
50 -
 51
51 -
 52
52 -
 53
53 -
 54
54 -
 55
55 -
 56
56 -
 57
57 -
 58
58 -
 59
59 -
 60
60 -
 61
61 -
 62
62 -
 63
63 -
 64
64 -
 65
65 -
 66
66 -
67
-
68
-
69
-
70
-
71
-
72
-
73
-
74
-
75
-
76
-
77
-
78
-
79
-
80
-
81
-
82
-
83
-
84
-
85
-
86
-
87
-
88
-
89
-
90
-
91
-
92
-
93
-
94
-
95
-
96
-
97
-
98
-
99
-
100
-
101
-
102
-
103
-
104
-
105
-
106
-
107
-
108
-
109
-
110
-
111
-
112
-
113
 |
 |
39
related to a change in management estimates on the redemption rate in our PowerUp Rewards and other customer liability programs.
In addition, we recorded an increase in gross profit due to a reclassification from selling, general and administrative expenses of
cash consideration received from our vendors to align those funds with the specific products we sell, net of the cost of free or
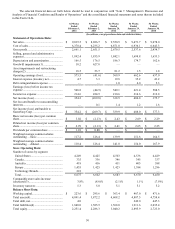
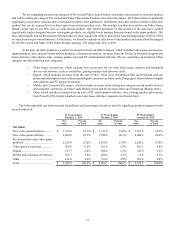
discounted products for our loyalty programs, in the amount of $42.5 million. Gross profit as a percentage of sales on new video
game hardware increased from 7.6% in fiscal 2012 to 10.2% in fiscal 2013 due to the mix of next generation consoles at a higher
margin rate, the reclassification of cash consideration received from vendors and increased sales of extended warranties. Gross
profit as a percentage of sales on new video game software increased from 21.9% for fiscal 2012 to 23.1% for fiscal 2013 due to
the reclassification of cash consideration received from vendors. Gross profit as a percentage of sales on pre-owned and value
video game products decreased from 48.1% in fiscal 2012 to 47.0% in fiscal 2013 due to aggressive trade offers made in the current
year in order to provide consumers with trade currency to help make new consoles more affordable. Gross profit as a percentage
of sales on video game accessories was comparable at 38.9% in fiscal 2012 and 39.3% in fiscal 2013. Gross profit as a percentage
of sales on digital sales increased from 58.0% in fiscal 2012 to 68.5% in fiscal 2013 due to conversion of full retail price revenue
digital currency cards into commission only currency cards. Gross profit as a percentage of sales on mobile and consumer electronics
revenues increased from 20.6% in fiscal 2012 to 21.4% in fiscal 2013 due to maturation of the mobile business within the video
game stores and due to the newly acquired Technology Brands stores. Gross profit as a percentage of sales on the other product
sales category decreased from 37.2% in fiscal 2012 to 36.1% in fiscal 2013.
Selling, general and administrative expenses increased by $56.5 million, or 3.1%, from $1,835.9 million in fiscal 2012
to $1,892.4 million in fiscal 2013. This increase was primarily due to higher variable costs associated with the increase in comparable
store sales during the second half of 2013 and the net increase in expenses associated with the change in classification of cash
consideration received from vendors and the reclassification of the cost of free or discounted products for our loyalty programs
discussed above. These increases were partially offset by expenses for the 53rd week in fiscal 2012 coupled with changes in foreign
exchange rates, which had the effect of decreasing fiscal 2013 selling, general and administrative expenses by $2.1 million when
compared to fiscal 2012. Additionally, cost control activities during the current year associated with the decline in sales at the end
of the previous console cycle helped to reduce our selling, general and administrative expenses along with lower current year store
counts. Selling, general and administrative expenses as a percentage of sales increased from 20.7% in fiscal 2012 to 21.0% in
fiscal 2013, primarily due to the classification of cash consideration received from vendors and loyalty costs as discussed above.
Included in selling, general and administrative expenses are $19.4 million and $19.6 million in stock-based compensation expense
for fiscal 2013 and fiscal 2012, respectively.
Depreciation and amortization expense decreased $10.0 million from $176.5 million in fiscal 2012 to $166.5 million in
fiscal 2013. This decrease was primarily due to a decrease in capital expenditures in recent years when compared to prior years,
which included significant investments in our loyalty and digital initiatives, as well as a decrease in new store openings and
investments in management information systems.
During fiscal 2013, we recorded a $28.7 million impairment charge, comprised of a $10.2 million goodwill impairment, a
$7.4 million impairment of technology assets and an impairment of $2.1 million of intangible assets as a result of our decision to
abandon Spawn Labs. Additionally, we recognized $9.0 million of property and equipment impairments during fiscal 2013. During
fiscal 2012, we recorded a $680.7 million impairment charge, comprised of $627.0 million of goodwill impairments, $44.9 million
of trade name impairment and $8.8 million of property and equipment impairments. Refer to Note 2 and Note 9 to the consolidated
financial statements in this Form 10-K for further information associated with these impairments.
Interest income resulting from the investment of excess cash balances was $0.9 million for both fiscal 2012 and fiscal 2013.
Interest expense increased from $4.2 million in fiscal 2012 to $5.6 million in fiscal 2013, primarily due to increased average
borrowings under our revolving credit facility during the year and interest expense incurred on pre-acquisition indebtedness of
one of the businesses acquired, prior to paying off the debt during fiscal 2013.
Income tax expense was $224.9 million on a $44.9 million loss before income tax expense in fiscal 2012, compared to
$214.6 million, or an effective tax rate of 37.7% in fiscal 2013. The difference in the effective income tax rate between fiscal 2013
and fiscal 2012 was primarily due to the recognition of the goodwill impairment charge in fiscal 2012 which is not tax deductible
and the recording of valuation allowances against certain deferred tax assets in the European segment in fiscal 2012. Without the
effect of the goodwill impairments and the recording of the valuation allowances, the effective income tax rate in fiscal 2012 would
have been 36.6%. Refer to Note 13 to our consolidated financial statements for additional information regarding income taxes.
The factors described above led to an increase in operating earnings of $615.1 million from an operating loss of $41.6 million
during fiscal 2012 to operating income of $573.5 million in fiscal 2013 and an increase in consolidated net income of $624.0 million
from a $269.8 million net loss in fiscal 2012 to $354.2 million of consolidated net income in fiscal 2013. The increase in operating
earnings is primarily attributable to goodwill and asset impairments recognized in fiscal 2012. Excluding the impact of the goodwill
and other impairment charges of $28.7 million, operating earnings would have been $602.2 million for fiscal 2013. Excluding the