GameStop 2013 Annual Report Download - page 90
Download and view the complete annual report
Please find page 90 of the 2013 GameStop annual report below. You can navigate through the pages in the report by either clicking on the pages listed below, or by using the keyword search tool below to find specific information within the annual report.-
 1
1 -
2
-
3
-
4
-
5
-
6
-
7
-
8
-
9
-
10
-
11
-
12
-
13
-
14
-
15
-
16
-
17
-
18
-
19
-
20
-
21
-
22
-
23
-
24
-
25
-
26
-
27
-
28
-
29
-
30
-
31
-
32
-
33
-
34
-
35
-
36
-
37
-
38
-
39
-
40
-
41
-
42
-
43
-
44
-
45
-
46
-
47
-
48
-
49
-
50
-
51
-
52
-
53
-
54
-
55
-
56
-
57
-
58
-
59
-
60
-
61
-
62
-
63
-
64
-
65
-
66
-
67
-
68
-
69
-
70
-
71
-
72
-
73
-
74
-
75
-
76
-
77
-
78
-
79
-
 80
80 -
 81
81 -
 82
82 -
 83
83 -
 84
84 -
 85
85 -
 86
86 -
 87
87 -
 88
88 -
 89
89 -
 90
90 -
 91
91 -
 92
92 -
 93
93 -
 94
94 -
 95
95 -
 96
96 -
 97
97 -
 98
98 -
 99
99 -
 100
100 -
101
-
102
-
103
-
104
-
105
-
106
-
107
-
108
-
109
-
110
-
111
-
112
-
113
 |
 |
F-17
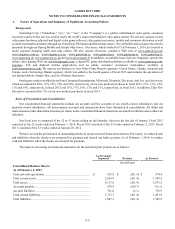
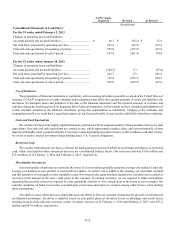
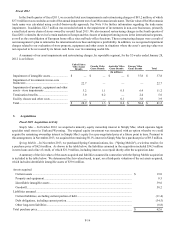
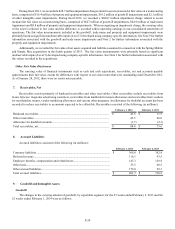
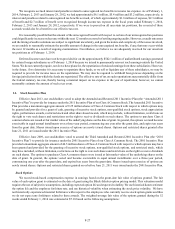
The excess of the net purchase price over the fair value of the net identifiable assets acquired of $50.2 million was recorded
as goodwill as illustrated in the table above. The goodwill, which is not deductible for tax purposes, represents a value attributable
to the position Spring Mobile holds as a top reseller of AT&T and its position in the marketplace which affords it the ability to
acquire smaller retailers and grow its retail network. As of February 1, 2014, we had not completed the final fair value assignments
and continue to analyze certain matters primarily related to the valuation of intangible assets.
In connection with our acquisition of Spring Mobile, we assumed a promissory note that Spring Mobile had previously
entered into related to its prior purchase of certain wireless stores. The promissory note has a remaining term of approximately
two years and had a carrying value of $4.0 million at February 1, 2014.
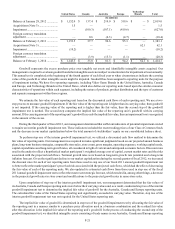
During the fourth quarter of 2014, Spring Mobile acquired four immaterial AT&T distributors for total consideration of $7.6
million.
We believe that Simply Mac and Spring Mobile represent important strategic growth opportunities for us within the specialty
retail marketplace and also provide avenues for diversification relative to our core operations in the video game retail marketplace.
The operating results of Simply Mac and Spring Mobile have been included in our consolidated financial statements beginning
on the respective closing dates of each acquisition and are reported in our Technology Brands segment. The pro forma effect
assuming these acquisitions were made at the beginning of each fiscal year presented herein is not material to our consolidated
financial statements.
Acquisition Activity in Fiscal 2012 and Fiscal 2011
During fiscal 2012, we completed acquisitions with a total consideration of $1.5 million, with the excess of the purchase
price over the net identifiable assets acquired, in the amount of $1.5 million recorded as goodwill. During fiscal 2011, we completed
acquisitions with a total consideration of $30.1 million, with the excess of the purchase price over the net identifiable assets
acquired, in the amount of $26.9 million, recorded as goodwill. We included the results of operations of the acquisitions, which
were not material, in the financial statements beginning on the closing date of each respective acquisition. The pro forma effect
assuming these acquisitions were made at the beginning of each fiscal year is not material to our consolidated financial statements.
Note 9 provides additional information concerning goodwill and intangible assets.
4. Vendor Arrangements
We and approximately 45 of our vendors participate in cooperative advertising programs and other vendor marketing
programs in which the vendors provide us with cash consideration in exchange for marketing and advertising the vendors’ products.
Our accounting for cooperative advertising arrangements and other vendor marketing programs results in a significant portion of
the consideration received from our vendors reducing the product costs in inventory rather than as an offset to our marketing and
advertising costs. The consideration serving as a reduction in inventory is recognized in cost of sales as inventory is sold. The
amount of vendor allowances to be recorded as a reduction of inventory was determined based on the nature of the consideration
received and the merchandise inventory to which the consideration relates. We apply a sell through rate to determine the timing
in which the consideration should be recognized in cost of sales. Consideration received that relates to video game products that
have not yet been released to the public is deferred.
The cooperative advertising programs and other vendor marketing programs generally cover a period from a few days up
to a few weeks and include items such as product catalog advertising, in-store display promotions, Internet advertising, co-op print
advertising and other programs. The allowance for each event is negotiated with the vendor and requires specific performance by
us to be earned.
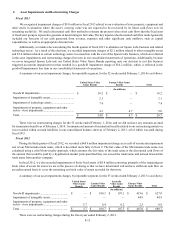
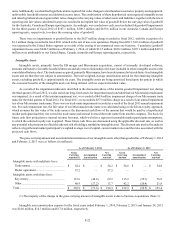
For fiscal 2013, we reclassified certain costs from selling, general and administrative expenses to cost of sales related to
cash consideration received from our vendors to align those funds with the specific products we sell. Vendor allowances of $221.0
million were recorded as a reduction of cost of sales for the 52 week period ended February 1, 2014. For the 53 week period
ended February 2, 2013 and the 52 week period ended January 28, 2012, vendor allowances recorded as a reduction of costs of
sales and selling, general and administrative expenses, were $134.8 million and $90.4 million and $99.0 million and $120.9 million,
respectively.
5. Computation of Net Income (Loss) per Common Share
Basic net income (loss) per common share is computed by dividing the net income (loss) available to common stockholders
by the weighted average number of common shares outstanding during the period. Diluted net income per common share is