GameStop 2013 Annual Report Download - page 103
Download and view the complete annual report
Please find page 103 of the 2013 GameStop annual report below. You can navigate through the pages in the report by either clicking on the pages listed below, or by using the keyword search tool below to find specific information within the annual report.-
 1
1 -
2
-
3
-
4
-
5
-
6
-
7
-
8
-
9
-
10
-
11
-
12
-
13
-
14
-
15
-
16
-
17
-
18
-
19
-
20
-
21
-
22
-
23
-
24
-
25
-
26
-
27
-
28
-
29
-
30
-
31
-
32
-
33
-
34
-
35
-
36
-
37
-
38
-
39
-
40
-
41
-
42
-
43
-
44
-
45
-
46
-
47
-
48
-
49
-
50
-
51
-
52
-
53
-
54
-
55
-
56
-
57
-
58
-
59
-
60
-
61
-
62
-
63
-
64
-
65
-
66
-
67
-
68
-
69
-
70
-
71
-
72
-
73
-
74
-
75
-
76
-
77
-
78
-
79
-
80
-
81
-
82
-
83
-
84
-
85
-
86
-
87
-
88
-
89
-
90
-
91
-
92
-
 93
93 -
 94
94 -
 95
95 -
 96
96 -
 97
97 -
 98
98 -
 99
99 -
 100
100 -
 101
101 -
 102
102 -
 103
103 -
 104
104 -
 105
105 -
 106
106 -
 107
107 -
 108
108 -
 109
109 -
 110
110 -
 111
111 -
 112
112 -
 113
113
 |
 |

F-30
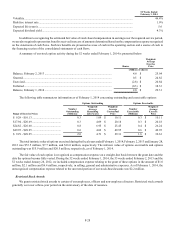
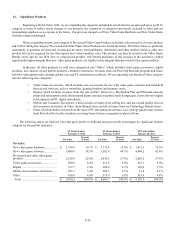
16. Significant Products
Beginning with this Form 10-K, we are expanding the categories included in our disclosures on sales and gross profit by
category in order to reflect recent changes in our business, the expansion of categories previously included in other and our
management emphasis as we operate in the future. Our previous categories of New Video Game Hardware and New Video Game
Software remain unchanged.
We are expanding our previous category of Pre-owned Video Game Products to include value-priced, or closeout, product
and will be calling the category Pre-owned and Value Video Game Products now and in the future. We believe there is significant
opportunity to purchase closeout and overstocked inventory from publishers, distributors and other retailers which is older new
product but can be acquired for less than typical new release product costs. This product can then be resold in our Video Game
Brands stores and on our Web sites as value-priced product. Our limited purchases of this product in the past have yielded
significantly higher margins than new video game products, yet slightly lower margins than pre-owned video game products.
In the past, all other products we sold were categorized into “Other”, which included video game accessories, digital
products, new and pre-owned mobile products, consumer electronics, revenues from our PowerUp Rewards program and Game
Informer subscription sales, strategy guides, toys and PC entertainment software. We are separating our historical Other category
into the following new categories:
• Video Game Accessories, which includes new accessories for use with video game consoles and hand-held
devices and software, such as controllers, gaming headsets and memory cards;
• Digital, which includes revenues from the sale of DLC, Xbox Live, PlayStation Plus and Nintendo network
points and subscription cards, other prepaid digital currencies and time cards, Kongregate, Game Informer digital
subscriptions and PC digital downloads;
• Mobile and Consumer Electronics, which includes revenues from selling new and pre-owned mobile devices
and consumer electronics in Video Game Brands stores and all revenues from our Technology Brands stores;
• Other, which includes revenues from the sales of PC entertainment software, toys, strategy guides and revenues
from PowerUp Pro loyalty members receiving Game Informer magazine in physical form.
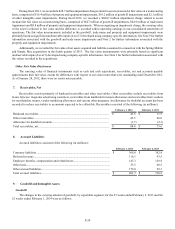
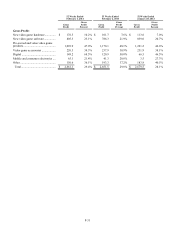
The following tables set forth net sales and gross profit (in millions) and gross profit percentages by significant product
category for the periods indicated:
52 Weeks Ended
February 1, 2014
53 Weeks Ended
February 2, 2013
52 Weeks Ended
January 28, 2012
Net Sales
Percent
of Total Net Sales
Percent
of Total Net Sales
Percent
of Total
Net sales:
New video game hardware................. $ 1,730.0 19.1% $ 1,333.4 15.0% $ 1,611.6 16.9%
New video game software.................. 3,480.9 38.5% 3,582.4 40.3% 4,048.2 42.4%
Pre-owned and value video game
products.............................................. 2,329.8 25.8% 2,430.5 27.4% 2,620.2 27.4%
Video game accessories ..................... 560.6 6.2% 611.8 6.9% 661.1 6.9%
Digital ................................................ 217.7 2.4% 208.4 2.3% 143.0 1.5%
Mobile and consumer electronics ...... 303.7 3.4% 200.3 2.3% 12.8 0.1%
Other .................................................. 416.8 4.6% 519.9 5.8% 453.6 4.8%
Total................................................. $ 9,039.5 100.0% $ 8,886.7 100.0% $ 9,550.5 100.0%