GameStop 2013 Annual Report Download - page 60
Download and view the complete annual report
Please find page 60 of the 2013 GameStop annual report below. You can navigate through the pages in the report by either clicking on the pages listed below, or by using the keyword search tool below to find specific information within the annual report.-
 1
1 -
2
-
3
-
4
-
5
-
6
-
7
-
8
-
9
-
10
-
11
-
12
-
13
-
14
-
15
-
16
-
17
-
18
-
19
-
20
-
21
-
22
-
23
-
24
-
25
-
26
-
27
-
28
-
29
-
30
-
31
-
32
-
33
-
34
-
35
-
36
-
37
-
38
-
39
-
40
-
41
-
42
-
43
-
44
-
45
-
46
-
47
-
48
-
49
-
 50
50 -
 51
51 -
 52
52 -
 53
53 -
 54
54 -
 55
55 -
 56
56 -
 57
57 -
 58
58 -
 59
59 -
 60
60 -
 61
61 -
 62
62 -
 63
63 -
 64
64 -
 65
65 -
 66
66 -
 67
67 -
 68
68 -
 69
69 -
 70
70 -
71
-
72
-
73
-
74
-
75
-
76
-
77
-
78
-
79
-
80
-
81
-
82
-
83
-
84
-
85
-
86
-
87
-
88
-
89
-
90
-
91
-
92
-
93
-
94
-
95
-
96
-
97
-
98
-
99
-
100
-
101
-
102
-
103
-
104
-
105
-
106
-
107
-
108
-
109
-
110
-
111
-
112
-
113
 |
 |

43
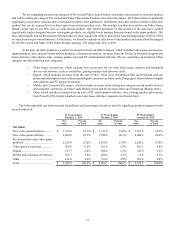
www.kongregate.com, a digital PC game distribution platform available at www.gamestop.com/pcgames and an online consumer
electronics marketplace available at www.buymytronics.com. As of February 1, 2014, the United States Video Game Brands
segment included 4,249 GameStop stores, compared to 4,425 stores on February 2, 2013.
Although net sales for fiscal 2013 decreased 0.5% compared to fiscal 2012, comparable store sales increased 3.0%. The
decrease in net sales was primarily due to a $185.9 million decline in sales due to a 4.1% decrease in domestic store count and
sales for the 53rd week in fiscal 2012. The increase in comparable store sales was primarily due to strong performance of new
video game console and title releases during the second half of the year, which more than offset the declines that had been
experienced during the first half of fiscal 2013.
Asset impairments of $24.0 million were recognized in fiscal 2013 primarily related to our decision to abandon our Spawn
Labs business. Asset impairments of $5.7 million were recognized in fiscal 2012 primarily related to impairment of finite-lived
assets. Segment operating income for fiscal 2013 was $465.3 million compared to $501.9 million in fiscal 2012. Excluding the
impact of asset impairments, segment operating income decreased $18.3 million from $507.6 million in fiscal 2012 to $489.3
million in fiscal 2013 primarily related to the impact of a decline in sales prior to the launch of the next generation consoles and
the impact of lower margin console sales as a percentage of total sales, as well as the impact of the operating earnings in the 53rd
week in fiscal 2012.
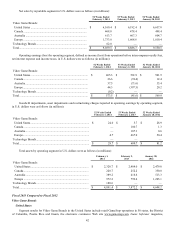
Canada
Segment results for Canada include retail operations in Canada and an e-commerce site. As of February 1, 2014, the Canadian
segment had 335 stores compared to 336 stores as of February 2, 2013. Net sales in the Canadian segment in the 52 weeks ended
February 1, 2014 decreased 2.0% compared to the 53 weeks ended February 2, 2013. The decrease in net sales was primarily
attributable to unfavorable changes in exchange rates of $22.3 million for fiscal 2013 and additional sales in the 53rd week of fiscal
2012 when compared to fiscal 2013, partially offset by an increase in sales at existing stores of 5.7%. The increase in net sales at
existing stores was primarily due to the launch of the next generation consoles.
The segment operating profit for fiscal 2013 was $26.6 million compared to an operating loss of $74.4 million for fiscal
2012. The increase in operating earnings was primarily due to the goodwill and asset impairment charges of $100.7 million
recognized during fiscal 2012. Excluding the impact of the goodwill and asset impairment charges, adjusted segment operating
earnings were $26.3 million in fiscal 2012. The increase in adjusted segment operating earnings was due to a decrease in selling,
general and administrative expenses as a result of lower sales and lower store count when compared to fiscal 2012, partially offset
by a $1.4 million unfavorable change in the exchange rate.
Australia
Segment results for Australia include retail operations and e-commerce sites in Australia and New Zealand. As of February 1,
2014, the Australian segment included 418 stores, compared to 416 stores as of February 2, 2013. Net sales for the 52 weeks ended
February 1, 2014 increased 1.1% compared to the 53 weeks ended February 2, 2013. The increase in net sales was primarily due
to a 12.6% increase in comparable store sales, partially offset by a $58.1 million reduction in sales associated with exchange rates
and the additional sales in the 53rd week of fiscal 2012. The increase in sales at existing stores was due to new video game console
and title releases.
The segment operating profit for fiscal 2013 was $37.5 million compared to an operating loss of $71.6 million for fiscal
2012. The increase in operating earnings was primarily due to the goodwill and asset impairment charges of $107.3 million
recognized during fiscal 2012, partially offset by a $4.8 million unfavorable change in the exchange rate. Excluding the impact
of the goodwill and asset impairment charges in 2012, segment operating earnings increased $1.8 million in fiscal 2013, when
compared to $35.7 million in fiscal 2012.
Europe
Segment results for Europe include retail operations in 11 European countries and e-commerce operations in six countries.
As of February 1, 2014, the European segment operated 1,455 stores, compared to 1,425 stores as of February 2, 2013. For the
52 weeks ended February 1, 2014, European net sales increased 7.8% compared to the 53 weeks ended February 2, 2013. This
increase in net sales was partially due to the favorable impact of changes in exchange rates in fiscal 2013, which had the effect of
increasing sales by $57.0 million when compared to fiscal 2012. Excluding the impact of changes in exchange rates, sales in the
European segment increased 4.2%. The increase in sales was primarily due to an increase in sales at existing stores of 3.2%, offset
by additional sales in the 53rd week of fiscal 2012 when compared to fiscal 2013. The increase in net sales at existing stores was
primarily due to new video game console and title launches.