GameStop 2013 Annual Report Download - page 20
Download and view the complete annual report
Please find page 20 of the 2013 GameStop annual report below. You can navigate through the pages in the report by either clicking on the pages listed below, or by using the keyword search tool below to find specific information within the annual report.-
 1
1 -
2
-
3
-
4
-
5
-
6
-
7
-
8
-
9
-
 10
10 -
 11
11 -
 12
12 -
 13
13 -
 14
14 -
 15
15 -
 16
16 -
 17
17 -
 18
18 -
 19
19 -
 20
20 -
 21
21 -
 22
22 -
 23
23 -
 24
24 -
 25
25 -
 26
26 -
 27
27 -
 28
28 -
 29
29 -
 30
30 -
31
-
32
-
33
-
34
-
35
-
36
-
37
-
38
-
39
-
40
-
41
-
42
-
43
-
44
-
45
-
46
-
47
-
48
-
49
-
50
-
51
-
52
-
53
-
54
-
55
-
56
-
57
-
58
-
59
-
60
-
61
-
62
-
63
-
64
-
65
-
66
-
67
-
68
-
69
-
70
-
71
-
72
-
73
-
74
-
75
-
76
-
77
-
78
-
79
-
80
-
81
-
82
-
83
-
84
-
85
-
86
-
87
-
88
-
89
-
90
-
91
-
92
-
93
-
94
-
95
-
96
-
97
-
98
-
99
-
100
-
101
-
102
-
103
-
104
-
105
-
106
-
107
-
108
-
109
-
110
-
111
-
112
-
113
 |
 |

3
Increase of cash dividend. In fiscal 2013 we paid dividends of $1.10 per share of Class A Common Stock, totaling
approximately $131 million for the year. On March 4, 2014, our Board of Directors authorized an increase in our annual cash
dividend from $1.10 to $1.32 per share of Class A Common Stock, which represents an increase of 20%. Additionally, on March
4, 2014, we declared our first quarterly dividend of fiscal 2014 of $0.33 per share of Class A Common Stock, payable on March 25,
2014 to stockholders of record on March 17, 2014.
Share repurchase activity. In fiscal 2013, we repurchased 6.3 million shares of our Class A Common Stock at an average
price per share of $41.12 for a total of $258.3 million. On November 19, 2013, our Board of Directors authorized us to use up to
$500 million to repurchase shares of our Class A Common Stock, replacing the $209.9 million remaining under our previous
authorization. Between February 2, 2014 and March 20, 2014, we repurchased an additional 0.6 million shares of our Class A
Common Stock for an average price per share of $37.17.
Our Reportable Segments
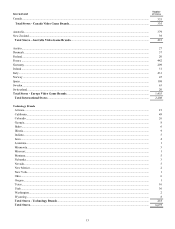
As of February 1, 2014, we operate our business in four Video Game Brands segments: United States, Canada, Australia
and Europe; and a Technology Brands segment. The Video Game Brands segments include 6,457 stores, 4,249 of which are
included in the United States segment. There are 335, 418, and 1,455 stores in the Canadian, Australian and European segments,
respectively. Each of the Video Game Brands segments consists primarily of retail operations, with all stores engaged in the sale
of new and pre-owned video game systems, software and accessories, which we refer to as video game products. Our Video Game
Brands stores sell various types of digital products, including downloadable content, network points cards, prepaid digital, online
timecards and digitally downloadable software. They also carry mobile and consumer electronics products, which consist primarily
of pre-owned mobile devices, tablets and related accessories. Our buy-sell-trade program creates a unique value proposition to
our customers by providing our customers with an opportunity to trade in their pre-owned video game and consumer electronics
products for store credits and apply those credits towards other merchandise, which in turn, increases sales. The products in our
Video Games Brands segments are substantially the same regardless of geographic location, with the primary differences in
merchandise carried being the timing of release of new products in the various geographies, language translations and the timing
of roll-outs of newly developed technology enabling the sale of new digital products. Stores in all Video Games Brands segments
are similar in size at an average of approximately 1,400 square feet.
Results for the Video Games Brands United States segment include retail operations in the 50 states, the District of Columbia,
Guam and Puerto Rico; the electronic commerce Web site www.gamestop.com; Game Informer magazine; www.kongregate.com,
a digital PC game distribution platform available at www.gamestop.com/pcgames; and an online consumer electronics marketplace
available at www.buymytronics.com. Segment results for Canada include retail and e-commerce operations in stores throughout
Canada and segment results for Australia include retail and e-commerce operations in Australia and New Zealand. Segment results
for Europe include retail and e-commerce operations in 11 European countries.
Our Technology Brands segment includes all of our Simply Mac, Spring Mobile and Aio Wireless stores. Simply Mac
operates 23 stores primarily in the western half of the United States, which sell Apple products, including desktop computers,
laptops, tablets and smart phones and related accessories and other consumer electronics products. As an authorized Apple reseller,
Simply Mac also offers certified training, warranty and repair services to its customers. Spring Mobile sells post-paid AT&T
services and wireless products through its 164 AT&T branded stores, as well as related accessories and other consumer electronics
products. Aio Wireless is a new AT&T brand offering pre-paid wireless services, devices and related accessories. We have opened
31 Aio Wireless stores in recent months in a few key markets throughout the United States. AT&T recently acquired Leap Wireless,
the operator of Cricket® (“Cricket”) branded pre-paid wireless stores. We expect that our Aio stores will be re-branded under the
Cricket name in the coming months.
Additional information, including financial information, regarding our reportable segments can be found in “Part II - Item
7. Management’s Discussion and Analysis of Financial Condition and Results of Operations” in this Annual Report on Form 10-
K (the "Form 10-K") and in Note 17 to our consolidated financial statements.
Disclosure Regarding Forward-looking Statements
This Form 10-K and other oral and written statements made by us to the public contain forward-looking statements within
the meaning of Section 27A of the Securities Act of 1933, as amended (the “Securities Act”), and Section 21E of the Securities
Exchange Act of 1934, as amended (the “Exchange Act”). The forward-looking statements involve a number of risks and
uncertainties. A number of factors could cause our actual results, performance, achievements or industry results to be materially
different from any future results, performance or achievements expressed or implied by these forward-looking statements. These
factors include, but are not limited to: