GameStop 2013 Annual Report Download - page 108
Download and view the complete annual report
Please find page 108 of the 2013 GameStop annual report below. You can navigate through the pages in the report by either clicking on the pages listed below, or by using the keyword search tool below to find specific information within the annual report.
F-35
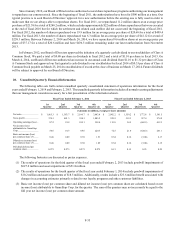
Since January 2010, our Board of Directors has authorized several share repurchase programs authorizing our management
to repurchase our common stock. Since the beginning of fiscal 2011, the authorizations have been for $500 million at a time. Our
typical practice is to seek Board of Directors’ approval for a new authorization before the existing one is fully used in order to
make sure that we are always able to repurchase shares. For fiscal 2011, we repurchased 11.2 million shares at an average price
per share of $21.38 for a total of $240.2 million, which excludes approximately $22 million of share repurchases that were executed
at the end of fiscal 2010 but for which the settlement and related cash outflow did not occur until the beginning of fiscal 2011.
For fiscal 2012, the number of shares repurchased was 19.9 million for an average price per share of $20.60 for a total of $409.4
million. For fiscal 2013, the number of shares repurchased was 6.3 million for an average price per share of $41.12 for a total of
$258.3 million. Between February 2, 2014 and March 20, 2014, we have repurchased 0.6 million shares at an average price per
share of $37.17 for a total of $20.6 million and have $436.5 million remaining under our latest authorization from November
2013.
In February 2012, our Board of Directors approved the initiation of a quarterly cash dividend to our stockholders of Class A
Common Stock. We paid a total of $0.80 per share in dividends in fiscal 2012 and a total of $1.10 per share in fiscal 2013. On
March 4, 2014, our Board of Directors authorized an increase in our annual cash dividend from $1.10 to $1.32 per share of Class
A Common Stock and approved our first quarterly cash dividend to our stockholders for fiscal 2014 of $0.33 per share of Class A
Common Stock payable on March 25, 2014 to stockholders of record at the close of business on March 17, 2014. Future dividends
will be subject to approval by our Board of Directors.
20. Unaudited Quarterly Financial Information
The following table sets forth certain unaudited quarterly consolidated statement of operations information for the fiscal
years ended February 1, 2014 and February 2, 2013. The unaudited quarterly information includes all normal recurring adjustments
that our management considers necessary for a fair presentation of the information shown.
Fiscal Year Ended February 1, 2014 Fiscal Year Ended February 2, 2013
1st
Quarter
2nd
Quarter
3rd
Quarter
4th
Quarter (2)
1st
Quarter
2nd
Quarter
3rd
Quarter(1)
4th
Quarter
(Amounts in millions, except per share amounts)
Net sales............................ $ 1,865.3 $ 1,383.7 $ 2,106.7 $ 3,683.8 $ 2,002.2 $ 1,550.2 $ 1,772.8 $ 3,561.5
Gross profit ....................... 578.3 481.3 598.3 1,003.2 599.9 519.3 557.4 974.9
Operating earnings (loss) .. 87.2 18.8 109.1 358.4 115.0 34.5 (603.5) 412.3
Net income (loss)
attributable to GameStop
Corp................................... 54.6 10.5 68.6 220.5 72.5 21.0 (624.3) 261.1
Basic net income (loss)
per common share (3) ....... 0.46 0.09 0.59 1.91 0.54 0.16 (5.08) 2.17
Diluted net income (loss)
per common share (3) ....... 0.46 0.09 0.58 1.89 0.54 0.16 (5.08) 2.15
Dividend declared per
common share ................... 0.275 0.275 0.275 0.275 0.15 0.15 0.25 0.25
The following footnotes are discussed as pretax expenses.
(1) The results of operations for the third quarter of the fiscal year ended February 2, 2013 include goodwill impairments of
$627.0 million and asset impairments of $51.8 million.
(2) The results of operations for the fourth quarter of the fiscal year ended February 1, 2014 include goodwill impairments of
$10.2 million and asset impairments of $18.5 million. Additionally, results include a $33.6 million benefit associated with
changes in accounting estimates primarily related to our loyalty programs and other customer liabilities.
(3) Basic net income (loss) per common share and diluted net income (loss) per common share are calculated based on net
income (loss) attributable to GameStop Corp. for the quarter. The sum of the quarters may not necessarily be equal to the
full year net income (loss) per common share amount.


