GameStop 2013 Annual Report Download - page 91
Download and view the complete annual report
Please find page 91 of the 2013 GameStop annual report below. You can navigate through the pages in the report by either clicking on the pages listed below, or by using the keyword search tool below to find specific information within the annual report.-
 1
1 -
2
-
3
-
4
-
5
-
6
-
7
-
8
-
9
-
10
-
11
-
12
-
13
-
14
-
15
-
16
-
17
-
18
-
19
-
20
-
21
-
22
-
23
-
24
-
25
-
26
-
27
-
28
-
29
-
30
-
31
-
32
-
33
-
34
-
35
-
36
-
37
-
38
-
39
-
40
-
41
-
42
-
43
-
44
-
45
-
46
-
47
-
48
-
49
-
50
-
51
-
52
-
53
-
54
-
55
-
56
-
57
-
58
-
59
-
60
-
61
-
62
-
63
-
64
-
65
-
66
-
67
-
68
-
69
-
70
-
71
-
72
-
73
-
74
-
75
-
76
-
77
-
78
-
79
-
80
-
 81
81 -
 82
82 -
 83
83 -
 84
84 -
 85
85 -
 86
86 -
 87
87 -
 88
88 -
 89
89 -
 90
90 -
 91
91 -
 92
92 -
 93
93 -
 94
94 -
 95
95 -
 96
96 -
 97
97 -
 98
98 -
 99
99 -
 100
100 -
 101
101 -
102
-
103
-
104
-
105
-
106
-
107
-
108
-
109
-
110
-
111
-
112
-
113
 |
 |

F-18
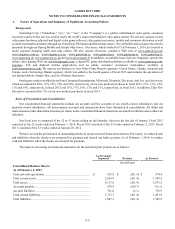
computed by dividing the net income available to common stockholders by the weighted average number of common shares
outstanding and potentially dilutive securities outstanding during the period. Potentially dilutive securities include stock options
and unvested restricted stock outstanding during the period, using the treasury stock method. Potentially dilutive securities are
excluded from the computations of diluted earnings per share if their effect would be antidilutive. A reconciliation of shares used
in calculating basic and diluted net income (loss) per common share is as follows:
52 Weeks Ended
February 1, 2014
53 Weeks Ended
February 2, 2013
52 Weeks Ended
January 28, 2012
(In millions, except per share data)
Net income (loss) attributable to GameStop Corp. ..................... $ 354.2 $ (269.7) $ 339.9
Weighted average common shares outstanding .......................... 117.2 126.4 139.9
Dilutive effect of options and restricted shares on common
stock ............................................................................................ 1.2 — 1.1
Common shares and dilutive potential common shares.............. 118.4 126.4 141.0
Net income (loss) per common share:
Basic............................................................................................ $ 3.02 $ (2.13) $ 2.43
Diluted......................................................................................... $ 2.99 $ (2.13) $ 2.41
The weighted average outstanding shares of Class A Common Stock for basic and diluted net loss per common share during
the 53 weeks ended February 2, 2013 were the same as we incurred a net loss from continuing operations during that period and
any effect on loss per share would have been antidilutive.
The following table contains information on share-based awards of Class A Common Stock which were excluded from the
computation of diluted earnings per share because their effects were antidilutive:
Anti-
Dilutive
Shares
(In millions)
52 Weeks Ended February 1, 2014................................................................................................................ 1.5
53 Weeks Ended February 2, 2013................................................................................................................ 3.3
52 Weeks Ended January 28, 2012................................................................................................................ 2.5
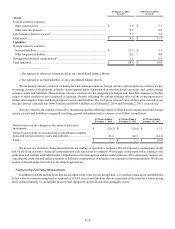
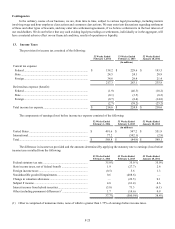
6. Fair Value Measurements and Financial Instruments
Recurring Fair Value Measurements and Derivative Financial Instruments
Fair value is defined as the price that would be received from selling an asset or paid to transfer a liability in an orderly
transaction between market participants at the measurement date. Fair value accounting guidance applies to our foreign currency
contracts, life insurance policies we own that have a cash surrender value and certain nonqualified deferred compensation liabilities
that are measured at fair value on a recurring basis in periods subsequent to initial recognition.
Fair value accounting guidance requires disclosures that categorize assets and liabilities measured at fair value into one of
three different levels depending on the observability of the inputs employed in the measurement. Level 1 inputs are quoted prices
in active markets for identical assets or liabilities. Level 2 inputs are observable inputs other than quoted prices included within
Level 1 for the asset or liability, either directly or indirectly through market-corroborated inputs. Level 3 inputs are unobservable
inputs for the asset or liability reflecting our assumptions about pricing by market participants.
We value our foreign currency contracts, our life insurance policies with cash surrender values and certain nonqualified
deferred compensation liabilities based on Level 2 inputs using quotations provided by major market news services, such as
Bloomberg and The Wall Street Journal, and industry-standard models that consider various assumptions, including quoted forward
prices, time value, volatility factors, and contractual prices for the underlying instruments, as well as other relevant economic
measures. When appropriate, valuations are adjusted to reflect credit considerations, generally based on available market evidence.
The following table provides the fair value of our assets and liabilities measured on a recurring basis and recorded on our
consolidated balance sheets (in millions):