GameStop 2013 Annual Report Download - page 57
Download and view the complete annual report
Please find page 57 of the 2013 GameStop annual report below. You can navigate through the pages in the report by either clicking on the pages listed below, or by using the keyword search tool below to find specific information within the annual report.-
 1
1 -
2
-
3
-
4
-
5
-
6
-
7
-
8
-
9
-
10
-
11
-
12
-
13
-
14
-
15
-
16
-
17
-
18
-
19
-
20
-
21
-
22
-
23
-
24
-
25
-
26
-
27
-
28
-
29
-
30
-
31
-
32
-
33
-
34
-
35
-
36
-
37
-
38
-
39
-
40
-
41
-
42
-
43
-
44
-
45
-
46
-
 47
47 -
 48
48 -
 49
49 -
 50
50 -
 51
51 -
 52
52 -
 53
53 -
 54
54 -
 55
55 -
 56
56 -
 57
57 -
 58
58 -
 59
59 -
 60
60 -
 61
61 -
 62
62 -
 63
63 -
 64
64 -
 65
65 -
 66
66 -
 67
67 -
68
-
69
-
70
-
71
-
72
-
73
-
74
-
75
-
76
-
77
-
78
-
79
-
80
-
81
-
82
-
83
-
84
-
85
-
86
-
87
-
88
-
89
-
90
-
91
-
92
-
93
-
94
-
95
-
96
-
97
-
98
-
99
-
100
-
101
-
102
-
103
-
104
-
105
-
106
-
107
-
108
-
109
-
110
-
111
-
112
-
113
 |
 |
40
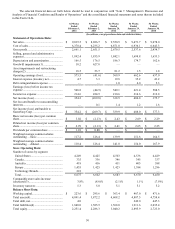
impact of goodwill and other impairment charges of $680.7 million, operating earnings would have been $639.1 million for fiscal
2012.
Fiscal 2012 Compared to Fiscal 2011
Net sales decreased $663.8 million, or 7.0%, to $8,886.7 million in the 53 weeks of fiscal 2012 compared to $9,550.5 million
in the 52 weeks of fiscal 2011. Sales for the 53rd week included in fiscal 2012 were $112.2 million. The decrease in net sales was
primarily attributable to a decrease in comparable store sales of 8.0% and changes in foreign exchange rates, which had the effect
of decreasing sales by $90.7 million when compared to the 52 weeks of fiscal 2011, offset partially by sales from the 53rd week
in fiscal 2012. The decrease in comparable store sales was primarily due to decreases in new video game hardware sales, new
video game software sales, pre-owned and value video game products sales and video game accessories sales offset partially by
an increase in digital, mobile and consumer electronics sales.
New video game hardware sales decreased $278.2 million, or 17.3%, from fiscal 2011 to fiscal 2012, primarily due to a
decrease in hardware unit sell-through related to being in the late stages of the previous console cycle and sales from the launch
of the Nintendo 3DS in the first quarter of fiscal 2011, which exceeded the sales from the launch of the Sony PlayStation Vita in
the first quarter of fiscal 2012. These sales declines were offset partially by the launch of the Nintendo Wii U in the fourth quarter
of fiscal 2012 and sales for the 53rd week in fiscal 2012. New video game software sales decreased $465.8 million, or 11.5%, from
fiscal 2011 to fiscal 2012, primarily due to a lack of new release video game titles in fiscal 2012 when compared to fiscal 2011
and declines in sales due to the late stages of the console cycle, offset partially by sales for the 53rd week in fiscal 2012. Pre-owned
and value video game products sales decreased $189.7 million, or 7.2%, from fiscal 2011 to fiscal 2012, primarily due to a decrease
in store traffic related to the lack of new release video game titles in fiscal 2012 when compared to fiscal 2011 and lower video
game demand due to the late stages of the previous console cycle, offset partially by sales for the 53rd week in fiscal 2012. Video
game accessories’ sales followed the same trends as other video game products given the late stages of the previous console cycle,
with a decline of $49.3 million, or 7.5% from fiscal 2011 to fiscal 2012. Sales of digital products increased $65.4 million, or 45.7%,
due to strong growth of DLC and digital currency sales. Our mobile and consumer electronics business grew $187.5 million from
its inception in late fiscal 2011 to a full year of sales in fiscal 2012. Sales of other product categories increased $66.3 million, or
14.6%, from fiscal 2011 to fiscal 2012 due to an increase in sales of PC entertainment software and toys in fiscal 2012 when
compared to fiscal 2011 and sales for the 53rd week in fiscal 2012.
As a percentage of net sales, new video game hardware sales and new video game software sales decreased and several other
product sales increased in fiscal 2012 compared to fiscal 2011. The change in the mix of net sales was primarily due to the increase
in digital and mobile and consumer electronics sales as a result of the expansion of both the digital and mobile sales categories
and in PC entertainment software and toys in the other product sales. These categories showed significant growth in fiscal 2012
while sales of new video game hardware and new video game software decreased due to fewer new software title launches compared
to the same period last year and lower sales due to the late stages of the console cycle. Cost of sales decreased by $635.8 million,
or 9.3%, from $6,871.0 million in fiscal 2011 to $6,235.2 million in fiscal 2012 primarily as a result of the decrease in net sales,
offset partially by cost of sales related to sales for the 53rd week in fiscal 2012 and the changes in gross profit discussed below.
Gross profit decreased by $28.0 million, or 1.0%, from $2,679.5 million in fiscal 2011 to $2,651.5 million in fiscal 2012.
Gross profit as a percentage of net sales was 28.1% in fiscal 2011 and 29.8% in fiscal 2012. The gross profit percentage increase
was primarily due to the increase in sales of digital, mobile and consumer electronics and other products as a percentage of total
net sales and the increase in gross profit as a percentage of sales on new video game hardware and software sales and pre-owned
and value video game products sales. Gross profit as a percentage of sales on new video game hardware increased slightly from
7.0% in fiscal 2011 to 7.6% in fiscal 2012. Gross profit as a percentage of sales on new video game software increased from 20.7%
for fiscal 2011 to 21.9% for fiscal 2012. Gross profit as a percentage of sales on pre-owned and value video game products increased
from 46.6% in fiscal 2011 to 48.1% in fiscal 2012 due to a decrease in promotional activities and improvements in margin rates
throughout most of our international operations when compared to the prior year. Gross profit as a percentage of sales on video
game accessories increased from 38.1% in fiscal 2011 to 38.9% in fiscal 2012. Gross profit as a percentage of sales on digital
revenues increased from 46.5% in fiscal 2011 to 58.0% in fiscal 2012 due to growth in the sales of DLC as a percentage of total
digital sales and conversion of full retail revenue digital currency cards into commission only currency cards. Gross profit as a
percentage of sales on mobile and consumer electronics sales decreased from 27.3% in fiscal 2011 to 20.6% in fiscal 2012. Gross
profit as a percentage of sales on the other product sales category decreased from 40.5% in fiscal 2011 to 37.2% in fiscal 2012.
Selling, general and administrative expenses decreased by $6.2 million, or 0.3%, from $1,842.1 million in fiscal 2011 to
$1,835.9 million in fiscal 2012. This decrease was primarily due to changes in foreign exchange rates which had the effect of
decreasing expenses by $26.7 million when compared to fiscal 2011 offset partially by expenses for the 53rd week in fiscal 2012.
Selling, general and administrative expenses as a percentage of sales increased from 19.3% in the fiscal 2011 to 20.7% in fiscal
2012. The increase in selling, general and administrative expenses as a percentage of net sales was primarily due to deleveraging