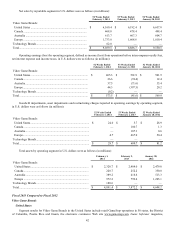
GameStop 2013 Annual Report Download - page 52
Download and view the complete annual report
Please find page 52 of the 2013 GameStop annual report below. You can navigate through the pages in the report by either clicking on the pages listed below, or by using the keyword search tool below to find specific information within the annual report.-
 1
1 -
2
-
3
-
4
-
5
-
6
-
7
-
8
-
9
-
10
-
11
-
12
-
13
-
14
-
15
-
16
-
17
-
18
-
19
-
20
-
21
-
22
-
23
-
24
-
25
-
26
-
27
-
28
-
29
-
30
-
31
-
32
-
33
-
34
-
35
-
36
-
37
-
38
-
39
-
40
-
41
-
 42
42 -
 43
43 -
 44
44 -
 45
45 -
 46
46 -
 47
47 -
 48
48 -
 49
49 -
 50
50 -
 51
51 -
 52
52 -
 53
53 -
 54
54 -
 55
55 -
 56
56 -
 57
57 -
 58
58 -
 59
59 -
 60
60 -
 61
61 -
 62
62 -
63
-
64
-
65
-
66
-
67
-
68
-
69
-
70
-
71
-
72
-
73
-
74
-
75
-
76
-
77
-
78
-
79
-
80
-
81
-
82
-
83
-
84
-
85
-
86
-
87
-
88
-
89
-
90
-
91
-
92
-
93
-
94
-
95
-
96
-
97
-
98
-
99
-
100
-
101
-
102
-
103
-
104
-
105
-
106
-
107
-
108
-
109
-
110
-
111
-
112
-
113
 |
 |
35
future cash flow projections is internal revenue forecasts, which our management believes represent reasonable market participant
assumptions, to which the selected royalty rate is applied. These future cash flows are discounted using the applicable discount
rate, as well as any potential risk premium to reflect the inherent risk of holding a standalone intangible asset. The discount rate
used in the analysis reflects a hypothetical market participant’s weighted average cost of capital, current market rates and the risks
associated with the projected cash flows. The primary uncertainties in this calculation are the selection of an appropriate royalty
rate and assumptions used in developing internal revenue growth forecasts, as well as the perceived risk associated with those
forecasts in developing the discount rate.
During the third quarter of fiscal 2012, we determined that sufficient indicators of potential impairment existed to
require an interim impairment test of our Micromania trade name. As a result of the interim impairment test of our Micromania
trade name, we recorded a $44.9 million impairment charge during the third quarter of fiscal 2012. We completed our annual
impairment tests of indefinite-lived intangible assets as of the first day of the fourth quarter of fiscal 2013 and fiscal 2012 and
concluded that none of our intangible assets were impaired. We completed our annual impairment test of indefinite-lived intangible
assets as of the first day of the fourth quarter of fiscal 2011 and concluded that our Micromania trade name was impaired due to
revenue forecasts that had declined since the initial valuation. As a result, we recorded a $37.8 million impairment charge for fiscal
2011. For additional information related to our intangible assets, see Note 9 to our consolidated financial statements.
Cash Consideration Received from Vendors. We participate in cooperative advertising programs and other vendor
marketing programs in which our vendors provide us with cash consideration in exchange for marketing and advertising the
vendors’ products. Our accounting for cooperative advertising arrangements and other vendor marketing programs results in a
significant portion of the consideration received from our vendors reducing the product costs in inventory rather than as an offset
to our marketing and advertising costs. The consideration serving as a reduction in inventory is recognized in cost of sales as
inventory is sold. The amount of vendor allowances to be recorded as a reduction of inventory was determined based on the nature
of the consideration received and the merchandise inventory to which the consideration relates. We apply a sell through rate to
determine the timing in which the consideration should be recognized in cost of sales. Consideration received that relates to video
game products that have not yet been released to the public is deferred.
The cooperative advertising programs and other vendor marketing programs generally cover a period from a few days up
to a few weeks and include items such as product catalog advertising, in-store display promotions, Internet advertising, co-op print
advertising and other programs. The allowance for each event is negotiated with the vendor and requires specific performance by
us to be earned.
Although we consider our advertising and marketing programs to be effective, we do not believe that we would be
able to incur the same level of advertising expenditures if the vendors decreased or discontinued their allowances. In addition, we
believe that our revenues would be adversely affected if our vendors decreased or discontinued their allowances; however, we are
not able to reasonably estimate or quantify the impact of such actions by our vendors.
Loyalty Program. The PowerUp Rewards loyalty program allows enrolled members to earn points on purchases in
our stores and on some of our Web sites that can be redeemed for rewards that include discounts or merchandise. Management
estimates the net cost of the rewards that will be issued and redeemed and records this cost and the associated balance sheet reserve
as points are accumulated by loyalty program members. The two primary estimates utilized to record the balance sheet reserve
for loyalty points earned by members are the estimated redemption rate and the estimated weighted-average cost per point redeemed.
Management uses historical redemption rates experienced under the loyalty program, prior experience with other customer
incentives and data on other similar loyalty programs as a basis to estimate the ultimate redemption rate of points earned. A
weighted-average cost per point redeemed is used to estimate future redemption costs. The weighted-average cost per point
redeemed is based on our most recent actual costs incurred to fulfill points that have been redeemed by our loyalty program
members and is adjusted as appropriate for recent changes in redemption costs, including the mix of rewards redeemed. We
continually evaluate our reserve methodology and assumptions based on developments in redemption patterns, cost per point
redeemed and other factors. Changes in the ultimate redemption rate and weighted-average cost per point redeemed have the effect
of either increasing or decreasing the reserve through the current period provision by an amount estimated to cover the cost of all
points previously earned but not yet redeemed by loyalty program members as of the end of the reporting period.
Lease Accounting. We lease retail stores, warehouse facilities, office space and equipment. These are generally leased
under noncancelable agreements that expire at various dates through 2034 with various renewal options for additional periods.
The agreements, which have been classified as operating leases, generally provide for minimum and, in some cases, percentage
rentals, and require us to pay all insurance, taxes and other maintenance costs. Leases with step rent provisions, escalation clauses
or other lease concessions are accounted for on a straight-line basis over the lease term, which includes renewal option periods
when we are reasonably assured of exercising the renewal options and includes “rent holidays” (periods in which we are not
obligated to pay rent). Cash or lease incentives received upon entering into certain store leases (“tenant improvement allowances”)
are recognized on a straight-line basis as a reduction to rent expense over the lease term, which includes renewal option periods
when we are reasonably assured of exercising the renewal options. We record the unamortized portion of tenant improvement