GameStop 2013 Annual Report Download - page 105
Download and view the complete annual report
Please find page 105 of the 2013 GameStop annual report below. You can navigate through the pages in the report by either clicking on the pages listed below, or by using the keyword search tool below to find specific information within the annual report.-
 1
1 -
2
-
3
-
4
-
5
-
6
-
7
-
8
-
9
-
10
-
11
-
12
-
13
-
14
-
15
-
16
-
17
-
18
-
19
-
20
-
21
-
22
-
23
-
24
-
25
-
26
-
27
-
28
-
29
-
30
-
31
-
32
-
33
-
34
-
35
-
36
-
37
-
38
-
39
-
40
-
41
-
42
-
43
-
44
-
45
-
46
-
47
-
48
-
49
-
50
-
51
-
52
-
53
-
54
-
55
-
56
-
57
-
58
-
59
-
60
-
61
-
62
-
63
-
64
-
65
-
66
-
67
-
68
-
69
-
70
-
71
-
72
-
73
-
74
-
75
-
76
-
77
-
78
-
79
-
80
-
81
-
82
-
83
-
84
-
85
-
86
-
87
-
88
-
89
-
90
-
91
-
92
-
93
-
94
-
 95
95 -
 96
96 -
 97
97 -
 98
98 -
 99
99 -
 100
100 -
 101
101 -
 102
102 -
 103
103 -
 104
104 -
 105
105 -
 106
106 -
 107
107 -
 108
108 -
 109
109 -
 110
110 -
 111
111 -
 112
112 -
 113
113
 |
 |

F-32
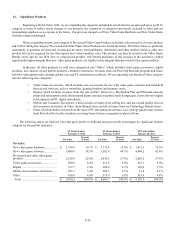
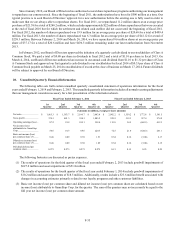
17. Segment Information
We operate our business in four Video Game Brands segments: United States, Canada, Australia and Europe, and a Technology
Brands segment, which was added in the fourth quarter of fiscal 2013 and includes the operations of our Spring Mobile, Simply
Mac, and Aio Wireless businesses. We identify segments based on a combination of geographic areas and management
responsibility. Each of the segments includes significant retail operations with all Video Game Brands stores engaged in the sale
of new and pre-owned video game systems and software and related accessories and Technology Brand stores engaged in the sale
of consumer electronics and wireless products and services. Segment results for the United States include retail operations in
50 states, the District of Columbia, Guam and Puerto Rico; the electronic commerce Web site www.gamestop.com; Game Informer
magazine; the online video gaming Web site www.kongregate.com; a digital PC game distribution platform available at
www.gamestop.com/pcgames; and an online consumer electronics marketplace available at www.buymytronics.com. Segment
results for Canada include retail and e-commerce operations in Canada and segment results for Australia include retail and e-
commerce operations in Australia and New Zealand. Segment results for Europe include retail operations in 11 European countries
and e-commerce operations in six countries. The Technology Brands segment includes retail operations in the United States. We
measure segment profit using operating earnings, which is defined as income from continuing operations before intercompany
royalty fees, net interest expense and income taxes. Transactions between reportable segments consist primarily of royalties,
management fees, intersegment loans and related interest. There were no intersegment sales during the 52 weeks ended February
1, 2014, the 53 weeks ended February 2, 2013 or the 52 weeks ended January 28, 2012.
Information on segments and the reconciliation of segment profit to earnings (loss) before income taxes are as follows (in
millions):
As of and for the Fiscal Year Ended February 1,
2014
United
States Canada Australia Europe
Technology
Brands Consolidated
Net sales......................................................... $ 6,160.4 $ 468.8 $ 613.7 $ 1,733.8 $ 62.8 $ 9,039.5
Segment operating earnings (loss)................. 465.3 26.6 37.5 44.3 (0.2) 573.5
Interest income .............................................. 0.9
Interest expense ............................................. (5.6)
Earnings before income taxes........................ 568.8
Other Information:
Goodwill ........................................................ 1,143.3 33.8 81.3 94.2 62.1 1,414.7
Other long-lived assets .................................. 320.0 20.8 40.4 269.3 76.6 727.1
Total assets..................................................... 2,320.7 228.7 389.2 972.2 180.6 4,091.4
Income tax expense ....................................... 173.2 11.6 8.8 21.0 — 214.6
Depreciation and amortization ...................... 115.4 4.4 10.5 35.3 0.9 166.5
Capital expenditures ...................................... 85.7 6.9 6.7 21.4 4.9 125.6